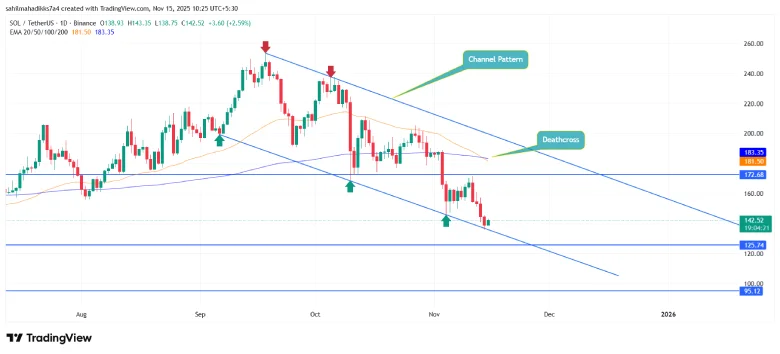
- Since mid-September, the Solana price has been actively resonating within the formation of a channel pattern.
- SOL active wallet numbers are sliding to nearly 3.41 million—the lowest level seen in twelve months.
- On-chain data address clusters offering substantial support thin out rapidly once SOL trades under the $144 mark.
SOL, the native cryptocurrency of the layer-1 blockchain Solana, fell 7.13% during Friday’s U.S. market hours to trade at $138.5. The selling pressure followed bearish sentiment in the broader cryptocurrency market as Bitcoin plunged to a six-month low of $93,961. However, the Solana price faces additional heat as market data recorded a substantial drop in user engagement, DeFi activity, and a drawdown in speculative force. Do SOL buyers have an opportunity to counterattack?
SOL Slides as Network Activity and Futures Positions Shrink
In a 4-day downfall, the Solana price plunged from a $172 swing high to a $142 trading value, accounting for a loss of 19.25%. This correction aligns with the broader market downturn, as the recently ended U.S. government shutdown has stalled the release of key economic data, including the Consumer Price Index (CPI). Without the inflation data, market uncertainty rose due to the already anticipated restrictive monetary policies from the Federal Reserve.
Signs of stress persist throughout the network metrics for Solana, as broader economic anxiety is weighing on digital asset activity. Recent chain data indicates user participation slipping steadily and the number of active wallets dropping to about 3.41 million, the lowest level in a year. The drop is pointing to a lower pace of transactions and general interaction with Solana-based applications.
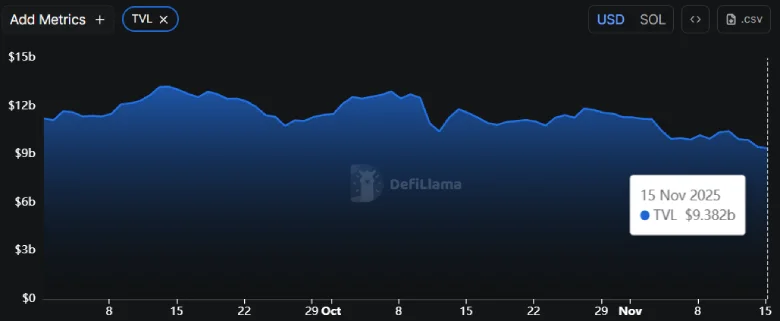
Activity around Solana’s decentralized finance space has also shrunken. The value currently deposited in major DeFi protocols on the network has dropped from around $10.4 billion to nearly $9.38 billion. The pullback is close to a tenth of the earlier capital locked into lending platforms, liquidity pools, and other smart contract systems.
Futures markets reflect a cooling tone. Open interest associated with Solana derivatives has also decreased significantly, from around $10.48 billion to $6.78 billion, indicating a 36% decline. This decline indicates that traders have significantly reduced their open position in future contracts, avoiding exposure during a volatile market.
This loss of speculative force and hedge activity continues to bolster a sluggish to downward trendline in price.
Solana Price Eyes 22% Rebound From Channel Pattern Support
With an intraday loss of 4%, Solana price plunged to the bottom trendline of a falling channel pattern in the daily timeline chart. The chart setup is characterized by two downsloping trendlines, which offer dynamic resistance and support to traders.
The recent history within the pattern shows that this support trendline has acted as a key accumulation zone for a buyer to recoup their exhausted bullish momentum. If the theory holds, the Solana price could rebound 21% and retest the $172 floor as potential resistance.
However, a recent death crossover between the 50- and 200-day exponential moving averages accentuates the broader market sentiment and aggressive selling pressure in price.
If momentum persists, this Solana price also faces a risk of a bearish breakdown below the channel pattern, extending its correction below the $144 level.

Fresh distribution data for Solana indicates a huge separation in realized buying activity below the $144 level. According to market analyst Ali Martinez, looking at the latest URPD readings, once prices fall below this zone, the number of holders with significant cost bases gets quite thin.
The chart shows that concentrated demand does not return until around the mid $20 range, which underlines a big liquidity void on the downside.
Also Read: BlackRock’s Tokenized Fund ‘BUIDL’ Launches BNB Chain


