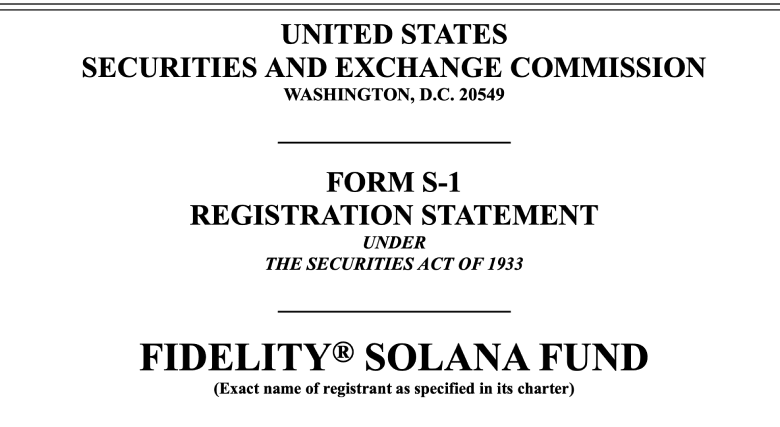
On Friday, June 13, the crypto market experienced a sudden sell-off as geopolitical tensions escalated in the Middle East. The Bitcoin price plunged to a low of $102,300, and the majority of major altcoins signaled the continuation of the correction trend. However, for the Solana price, the bearish momentum faded at the $140 support level, as evidenced by a long-tail rejection candle. The bullish development can be linked to increasing hope for the spot SOL ETF, and Fidelity filed a Form S-1 registration statement for the Solana fund.
Fidelity Files for Spot Solana ETF
On June 13th, financial giant Fidelity officially filed a Form S-1 Registration Statement with the U.S. Securities and Exchange Commission (SEC) to launch a spot Solana exchange-traded fund (ETF). The ETF aims to provide retail and institutional investors with regulated exposure to the SOL coin of the Solana ecosystem without requiring them to hold the asset directly.
According to the filing, the Fidelity Solana fund is structured as an exchange-traded product (ETP) that issues shares representing fractional ownership of the trust’s SOL holdings. These are proposed to be listed on the Cboe BZX exchange.
The trust intends to track the price of SOL using volume-weighted median price (VWMP) methodology, which draws real-time data from SOL spot markets.
The sponsor of the trust is FD Funds Management LLC. While acting as trustee, CSC Delaware Trust Company is a fiduciary that holds legal title to the trust assets.

In addition, a portion of the trust’s SOL will be staked with trusted staking providers, generating a yield stream through staking rewards.
After this filing, the SEC will review the proposed ETF structure and determine if it aligns with investors’ protection standards and market manipulation safeguards. If approved, the ETF will pave the way for regulated investment flow into Solana.
SOL Buyers Defend Major Support
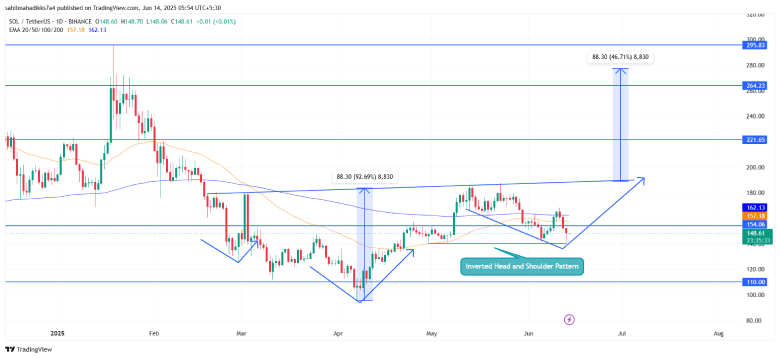
Despite the intraday sell-off, the Solana price held steady above the $140 support. The daily candle shows long wick rejection at the aforementioned support, accentuating the intact demand pressure and buy-the-dip sentiment among investors.
Concerning the price retest to the $140 floor, the momentum indicator RSI shows a fresh high-low formation above the 40% mark, further accentuating the rising bullish momentum. A potential bullish reversal could push the SOL price 28% higher and reveal the formation of an inverted head and shoulders pattern. The chart setup is characterized by three troughs—a deep central dip flanked by two shallower ones.
Following this pattern, the Solana price could reach the neckline resistance at $188 to signal a change in market direction.

On the contrary, if the seller continues to defend the neckline barrier, the current consolidation could extend till next month.
Also Read: Bitcoin Risks Double Top Breakdown to $92,000 as Whales Start Selling


