


Key Highlights:
- Solana price breakdown below the support trendline of a bullish continuation pattern signals the accelerating pressure and risk for a prolonged downfall.
- The number of active addresses on the network records a notable fall of over 13% to signal a cooldown in user engagement.
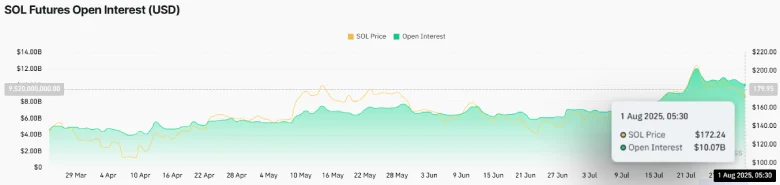
- A 16% fall in futures open interest indicates the waning investor’s interest and reduced speculative activity in the market.
- A rising channel pattern drives the mid-term recovery trend in price.
On Thursday, July 31st, the Solana price continued its losing streak with a 2.2% intraday loss to reach $168.6 trading value. This selling pressure aligned with a broader market pullback as Bitcoin teases a breakdown below the $115,000 mark. However, the SOL coin faces the risk of prolonged correction as the number of active addresses takes a major hit and the derivative market data highlights a slowdown in speculative trading. Will the price break the $150 floor?
Solana Price Slides as Network Engagement, Futures Drop
In the past two weeks, the Solana price showcased a V-top reversal from $206.3 to the current trading price of $169.3, accounting for an 18% loss. The selling price aligns with the broader market pullback as the majority of major assets entered a post-rally correction to recuperate their exhausted bullish momentum.
However, the sellers are steadily strengthening their grip on SOL, as the on-chain shows a notable drop in the number of active addresses on the network. According to TheBlock data, the number of active addresses on the network has dropped from $3.53 million to $3.07 million, now accounting for a 13% loss.
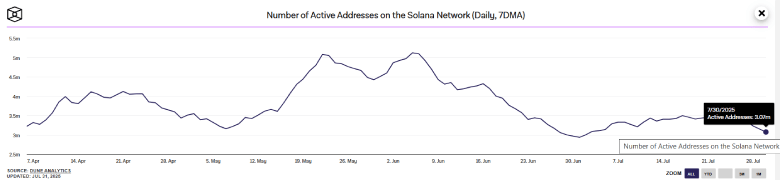
This suggests a noticeable reduction in user activity or engagement on the network, potentially signaling cooling retail interest and declining transaction demand.
Simultaneously, the SOL futures open interest has reverted from $12.01 billion to $10.07 billion, projecting a 16.15% decline. The downswing implies a reduction in speculative activity and leverage position in the market.
Thus, the SOL coin could witness a broader cooldown in network engagement as both on-chain and derivatives market data signal waning investor enthusiasm.
If the trend persists, these coin prices could struggle to recoup the bullish momentum and drive a prolonged downfall in the near future.
SOL Faces Breakdown Below Bullish Flag Pattern
The 4-hour chart analysis of Solana Price shows the recent market correction resonated actively within the two converging trendlines of a bull flag pattern. The chart setup is characterized by a long ascending pole, denoting the dominating uptrend in the market, followed by a temporary pullback to recuperate the exhausted bullish momentum.
The coin bounced at least twice from both trendlines, validating its credibility to influence the price movement.
With today’s price drop, the coin price teases a bearish trend from the pattern’s support trendline, indicating that the sell-side pressure exceeds the buyers’ potential to hold this pattern.

If the 4-hour candle closes below the support trendline, the sellers could drive an 11.3% drop to test the support trendline of a long-coming channel pattern at $147.74.
Since March 2025, the altcoin has been steadily resonating within two ascending trendlines, which offer dynamic support and resistance to price. Historical data shows the bottom trendline has acted as a major accumulation zone for buyers and bolstered a bullish reversal, registering 60% to 93% growth.

Thus, until the price is intact, the SOL price could maintain a sustained recovery.
