


The Solana price shows potential for a breakout from a 100-day accumulation trend amid an inverted head and shoulders pattern breakout and rising user activity. On Thursday, June 11th, the Solana price dropped 1.17% to trade at $162.50. The selling pressure likely followed a broader market downtick as an opportunity to regain momentum that had been exhausted by the bulls. For SOL coin, this pullback could be short-lived, as it shows potential for a quick reversal amid the development in the spot ETF approval.
SEC requests updated S-1 filings from ETF issuers
The U.S. Securities and Exchange Commission has instructed prospective Solana ETF issuers to submit an amended S-1 filing within the next week, according to a report by Blockworks. The agency has decided to review and provide feedback on these submissions in the following 30 days.
Notably, the SEC has requested that issuers update language surrounding in-kind redemptions and inquired about their approach to staking, indicating a potential openness to integrating staking features in these ETFs.
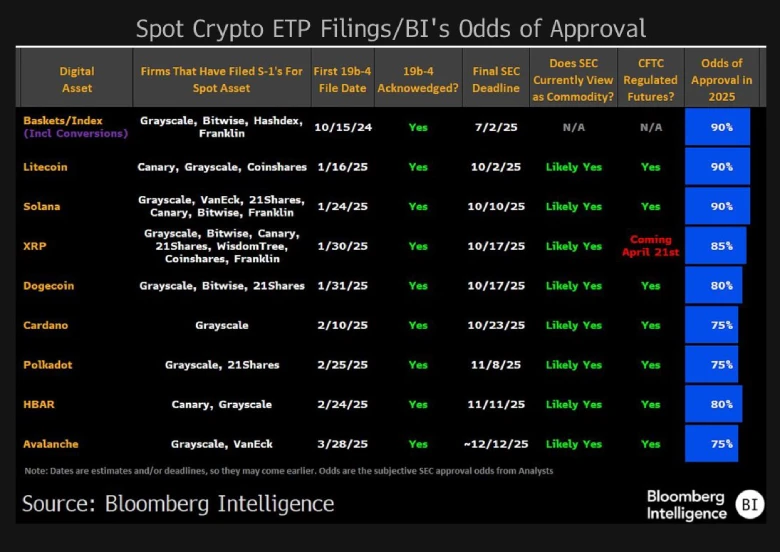
In a recent tweet, Bloomberg analyst James Stetffary shared an updated list of different spot ETFs with their chances of approval. Following the SEC’s movement, the odds for Solana ETFs approval in 2025 have surged to 90%.
If approved, the Solana spot ETF will allow retail and institutional investors to gain exposure to SOL’s price movement without holding the actual cryptocurrency. Similar to Bitcoin and Ethereum ETFs, the SOL-ETF could attract high demand and boost liquidity for the asset.
Sonala Price Bounced With an Inverted Head and Shoulder Pattern
Over the last six days, the Solana price bounded from $141 to $168, registering a 19% growth. An analysis of daily charts revealed this upswing as the potential right shoulder of a bullish reversal pattern known as an inverted head and shoulders.
Historically, this chart setup has been spotted at the bottom of a downtrend, which initiates a change in market dynamics. If the pattern holds, the SOL price could bounce to 18.3% and challenge the neckline resistance at $190.
A potential breakout from resistance will intensify the buying pressure and bolster a 46% rally to $277.

On the contrary, if the daily candle shows selling pressure at the neckline resistance, the coin price could shift to a sideways trend.
Also Read: Bitcoin Price Ready for New High Amid Whale Support And Healthy Correction
