


On Monday, June 23rd, the crypto market experienced a massive inflow as U.S. President Donald Trump announced a complete ceasefire between Israel and Iran, thus potentially ending “The 12 DAY WAR.” Following the announcement, the Bitcoin price quickly rebounded above $105,000, and a majority of major cryptocurrencies, including Solana, surged sharply. However, it failed to confirm if the bullish upswing could end the correction trend for Solana, as its declining trend in network activity shows weakness in holders’ conviction.
Geopolitical Ceasefire Triggers Crypto Market Rebound
Over the weekend, the crypto market witnessed a sudden sell-off as the geopolitical tension in the Middle East continued to accelerate after the United States bombed three Iranian nuclear sites. However, on Monday, the market witnessed a major diplomatic development as Iran and Israel agreed to a complete 24-hour ceasefire, bringing an end to what is now being called the ‘12th Day War.’
According to the recent Truth post from Donald Trump, the ceasefire will commence in approximately 6 hours, starting with Iran, followed by Israel after 12 hours. Both sides are expected to maintain peace and mutual respect during the 24-hour cessation.
The crypto market reacted positively, with Bitcoin reclaiming the $105,000 mark, while SOL coin bounced over 10% to chase the $150 barrier.
Despite the positive price movement, the number of active addresses on the Solana network has continued to decline at a rapid pace. According to TheBlock data, the metric shows a sharp reversal from 512 million addresses in early May 2025 to 3.66 million addresses now, representing a 28% decline.
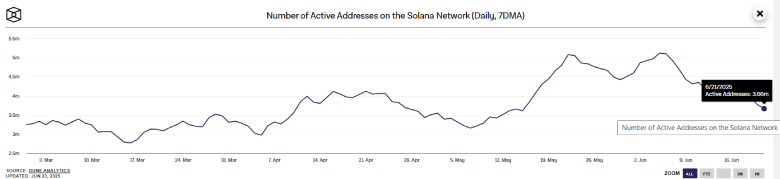
This downswing suggests weakening network engagement and user activity. If the trend continues, the network will struggle to attract sustained demand pressure.
SOL Price Eyes Major Breakout Amid Flag Pattern
By press time, the Solana price was trading at $148.46 and had shown an intraday gain of 10.2%. This jump indicated a sharp bullish reversal within the formation of a bull flag pattern on the daily chart. Theoretically, the chart setup displays a long pole, which denotes the dominant trend in the asset, followed by a short pullback that allows buyers to regain bullish momentum.
Since late May 2025, the SolPrice has been actively resonating between the two converging tendons of the flag structure. With today’s bounce, the altcoin is just 4% short of surpassing the overhead resistance at $150.
If the price breaks out, buyers will also regain control of the fast-moving 20- and 50-day exponential moving averages, reinforcing the initial surge in bullish sentiment. With sustained buying, the post-breakout rally could surge to $168, followed by a leap to $187.

On the contrary, if sellers continue to defend overhead resistance and the network’s active addresses continue to decline, the SOL price could revert and plunge to the $120 floor.
