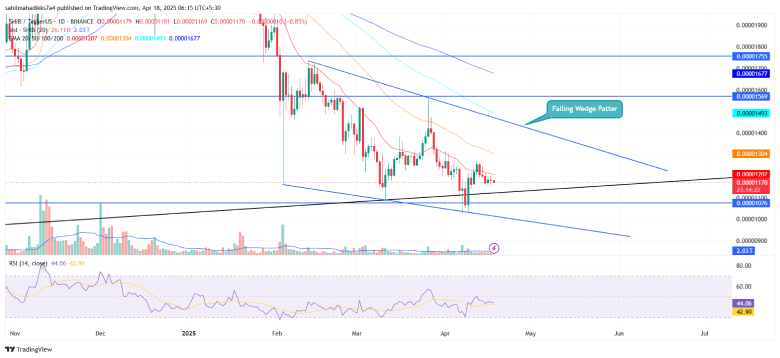
In April’s third week, the cryptocurrency market witnessed low volatility movement as investor sentiment remained uncertain around the U.S. reciprocal tariff. This consolidation has limited Bitcoin’s recovery below $85,000, while most major altcoins, including Shiba Inu, struggle to hold stable support.
However, the downward trend in this meme coin shows the potential formation of a renowned reversal pattern, signaling an opportunity for bullish recovery.
Falling Wedge Pattern Sets Stage for Shiba Inu Recovery
This week, the Shiba Inu price followed a bearish pullback from $0.0000125 to $0.00001178, accounting for a 6.35% fall. The selling pressure followed broader market uncertainty, as China’s retaliation against Donald Trump’s barrage of tariffs kept investors’ sentiment on edge.
As the SHIB price reverts below the 20-day EMA, the sellers may extend the correction another 14% down to the support trendline of the falling wedge pattern at $0.0000105.
Since February 2025, the chart setup has carried a slow downtrend line within two converging trendlines, providing dynamic resistance and support. As the previous upswing within this pattern has lifted a recovery ranging from 44% to 49%, the potential downfall could bolster Shiba Inu with renewed bullish momentum.
With sustained buying, the coin price is likely to retest the pattern overhead resistance at $0.000013, teasing a bullish breakout. If successful, the buyers will gain a better grip on this asset and drive a rally towards $0.000157, followed by $0.0000175.

On the contrary, if sellers continue to defend the overhead resistance, the price will revert below, signaling the continuation of the current trendline.
Exponential Moving Average: The coin price trading below the 20-day EMA slope indicates the market momentum is aggressive. Bearish. Moreover, the bearish alignment between these EMAs (20<50<100<200) accentuates that the path of least resistance is down.
Relative Strength Index: Dyeing the downtrend in SHIB, the momentum indicator shows a fresh higher low formation, indicating the rising buying pressure.
Also Read: Here’s Why Cardano Price is Set to Breach $0.8 Barrier


