This weekend, the crypto market witnessed a slight slowdown in recovery momentum as Bitcoin price struggled to break the $95,000 barrier. The overhead supply in BTC has interrupted buying pressure on altcoins, especially the highly volatile memecoins. This Shiba Inu coin shows the behavior as the price reverts from $0.0000152 resistance to $0.0000136, registering a 10.2% fall in 72 hours. Do buyers have an opportunity to counterattack?
Double-Bottom Sets Shiba Inu For Rally
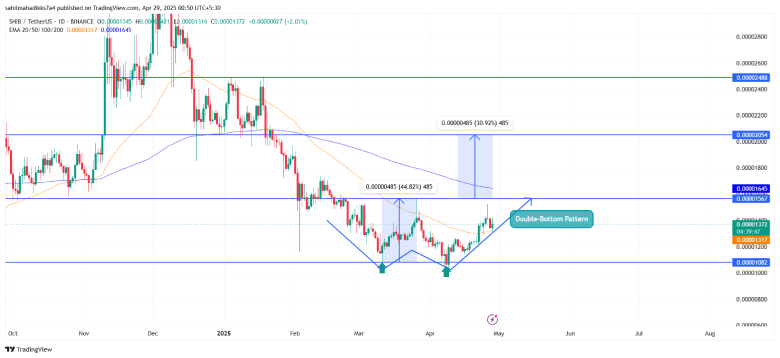
In recent Shiba coin news, the price bounced from the $0.00001053 floor to the $0.00001358 current trading value, accounting for a 29% gain. The upswing breached key resistance of $0.0000128 and reclaimed fast-moving EMAs (20 and 50), accentuating an initial change in market sentiment.
In addition, the daily chart analysis shows the reversal as the formation of a well-known reversal pattern called the double-bottom pattern. Theoretically, the pattern shows a W-shaped reversal indicating renewed demand pressure at the bottom support.
By press time, the dog-themed memecoin trades at $0.00001358, with an intraday gain of 1.7%. Consecutively, the asset market cap rose to $8.03 billion, according to CoinGecko.
If the pattern holds true, the Shiba price will 50-day EMA slope and rebound 16% to challenge the $0.00001675 neckline.
A potential breakout from the resistance will accelerate the buying pressure to target the $0.0000177 mark, followed by $0.00002.

The completion of the pattern will signal the recuperation of bullish momentum and initiate a change in the market trend.
On a contrary note, if the sellers continue to defend the $0.00001645 resistance, the Shiba coin price will continue to move sideways for the coming months.
Exponential Moving Average: The recently reclaimed 20-and-50 EMA slope would offer dynamic support for the current recovery. However, this cryptocurrency trading below the 100- and 200-EMA indicates a broader bearish trend.
Relative Strength Index: Concerning the two price reversals from $x support, the momentum indicator RSI shows a higher low formation, reinforcing the rising buying pressure at lower levels to support a bullish reversal.
Also Read: Will Bitcoin Emerge As a Safe Haven Amid TradFi Downturn


