
The SEI price is poised for a bullish breakout from a two-month consolidation amid renewed traders’ activity in the derivative market.
- The SEI price is currently riding a mid-term consolidation trend within the formation of a bull-flag pattern.
- SEI open interest jumped over 17% in the last two days, signaling renewed activity in the derivative market.
- A bullish crossover between the 100- and 200-day exponential moving average signals accelerating bullish momentum.
SEI, the native cryptocurrency of the Sei blockchain, shows an insignificant loss of 0.45% during Tuesday’s market hours. While a majority of major cryptocurrencies followed Bitcoin for a bearish downtick, the SEI price showed firm resilience and managed to hold above $0.3. The buying pressure likely followed the development surrounding the Canary-staked SEI ETF and renewed traders’ activity in the futures market. Will the SEI coin hit the $0.5 mark?
SEI Jumps Amid Renewed Derivatives Inflows
So far in September, the crypto market has witnessed a notable correction across multiple coins, including Bitcoin. The selling pressure likely rose due to market FUD surrounding the interest rate by the U.S. Federal Reserve.
Defying the bearish sentiment, the SEI price bounced from $0.265 to the current trading price of $0.31, registering an 18% jump within two weeks. The buying pressure gained additional momentum as asset management company Canary registered for a Spot Staked SEI ETF.
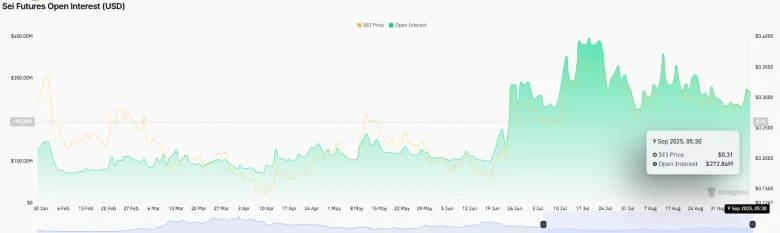
In addition, Sei derivatives have experienced a significant recovery in the derivatives market in the last 48 hours. Coinglass data shows an upsurge of about 17% in open interest as it rose by about 230 million to 270 million. Sei’s reentry into the derivatives market is sharp, indicating a reversal of capital inflow amid price recovery.
Open interest measures the total value of outstanding futures contracts and is used to measure leverage and positioning in the market. The rapid increase implies that the participants are once again accumulating exposure to Sei either via new long bets or via hedging.
However, the rates of funding of perpetual futures have not changed significantly despite the rise in the value of contracts. The open interest-weighted funding rate is maintaining a constant of 0.0101%, which is an indication of a balance between the buyers and sellers.
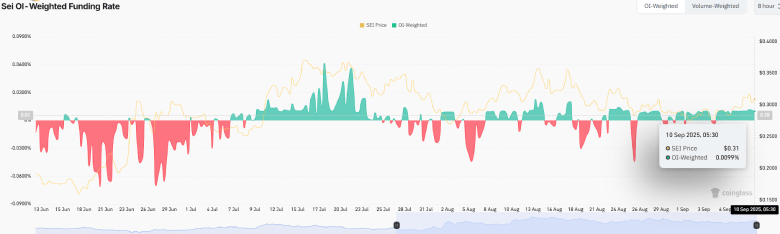
Stable funding implies that no long or short position is paying a premium, and thus the market is in balance in the meantime. The upswing in open interest, without a corresponding change in the funding rate, indicates an explosion in trading activity with no strong directional bias.
Also Read: Grayscale Files for Litecoin, Bitcoin Cash, and Hedera ETFs
SEI Price Coiling Major Breakout Within Pennant Pattern
In the past two weeks, the SEI price shows a short consolidation trend resonating within two converging tenons of a bullish pennant pattern. The chart setup is characterized by an ascending trend line, which denotes the dominating trend in price, followed by a temporary pullback to recuperate the exhausted bullish momentum.
The coin price bounced twice from each trend line, validating the credibility of this pattern to influence the price trajectory.
A flattish trend among the 100- and 200-day EMA slopes accentuates the mid-term sideways sentiment among market participants. However, the 100-day EMA has recently crossed above the 200-day EMA slope, indicating the restoration of bullish momentum.
By the present time, the SEI coin trades at $0.31, positioning just 5.6% short of challenging the pattern’s resistance trend at $0.38. A bullish breakout from the dynamic resistance would signal the continuation of the prevailing recovery and bolster the price for a $0.4 leap.

On the contrary, if the sellers continue to defend the overhead trendline, the coin price will prolong its sideways action, resonating within this triangle.
Also Read: Is BONK Price Ready To Blast Off? Bullish Indicators Signal 200% Surge

