


On Tuesday, June 17th, the Pepe coin price experienced a sudden sell-off, reaching a low of $0.00000965. This selling pressure can be attributed to Bitcoin’s reversal from the $108,000 region and escalating geopolitical tension in the Middle East. Despite the mounting bearish momentum, a crypto whale shows its confidence in this memecoin while an emerging bullish pattern signals the continuation of the uptrend.
Whale Bet Millions in PEPE Amid Discounted Value
The Pepe coin experienced a sharp downtrend from $0.00001345 to $0.00001017 over the week, resulting in a 24% loss. This downturn likely followed a broader market trend as the military action between Iran and Israel raised market FUD (fear, uncertainty, and doubt).
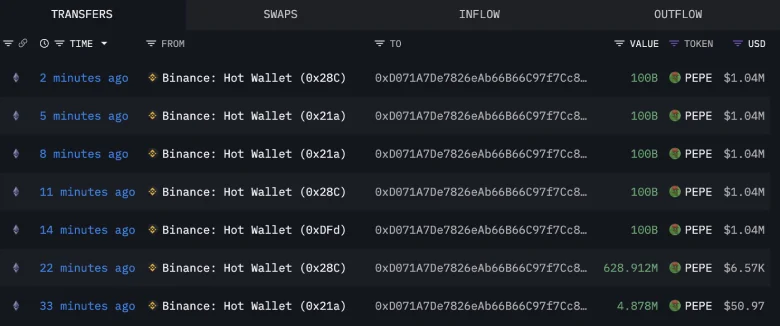
Despite the bearish momentum, the on-chain data shows a substantial accumulation from a crypto whale leveraging the discounted value. According to Lookonchain data, a newly created wallet withdrew 500.6 billion PEPE (worth approximately 5.2 million) from the Binance exchange.
Such accumulation trends from high-net-worth individuals have often led to a bullish turnaround in coin price, offering an early signal for recovery.
Pepe Coin Price Eyes 60% Rally Amid Flag Formation
An analysis of Pepe’s daily chart shows the current correction has been intact since late May 2025. However, this bearish pullback is resonating strictly within two covering trendlines, revealing the formation of a bull-flag pattern.
The chart setup consists of a long pole denoting the primary uptrend, followed by a temporary pullback to recuperate the exhausted bullish momentum. Despite the intraday downtick, the daily candle shows a notable rejection on its tail, indicating the strong demand pressure at the bottom.
Thus, a potential rebound will push the asset 10% up to challenge the resistance trendline at $0.0000113. A successful flip of the overhead resistance into potential support will accelerate buying pressure and bolster a further 45% surge to reach $0.0000164.

On the contrary, the momentum indicator RSI (Relative Strength Index) is at 38%, indicating the sellers are the current dominant force in the market. Thus, a bearish breakdown below the bottom support trendline will accelerate the selling pressure and drive a prolonged downfall towards $0.00000758.
Also Read: 3 Key Reasons Why Ethereum Price May Hit $3,000 in June
