During Wednesday’s U.S. market session, the SUI price recorded a 3.44% intraday surge to trade at $2.49. The buying pressure followed a broader market uptick with the Bitcoin price nearing a $90,000 breakout. As the altcoin market gains momentum, market analysts have taken a keen interest in SUI price movement as it forms a bullish reversal pattern, bolstering its rally to $2.5.
Key Highlights:
- The $2.85 level, backed by the 200-day exponential moving average, creates a high-selling zone for crypto traders.
- A potential breakout from the inverted head and shoulder pattern sets the SUI price rally past $3 resistance.
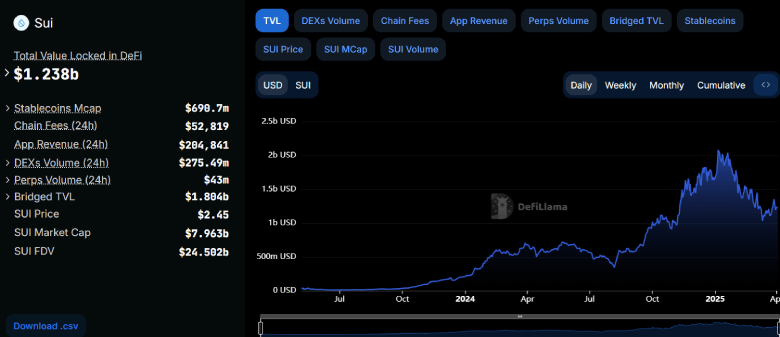
- SUI price recovery coinciding with the surge in total volume locked (TVL) indicates growing investor confidence.
Rising TVL and Market Sentiment Support SUI Price Breakout
Over the last three weeks, the SUI price showcased a slow yet sustained recovery from $1.96 to $2.47, its current trading value, registering a 25% growth. Consecutively, the asset market cap surged to $7.97 billion.
Following the price movement, the Total Volume Locked (TVL) on the SUI network bounded from $1.03 billion to $1.23 billion, accounting for a 19.42% surge. This sharp rise in TVL reflects increased investor confidence and growing on-chain activity within the SUI ecosystem. A higher TVL suggests that more assets are being staked or utilized in DeFi protocols, which often correlates with bullish sentiment.
If sustained, this could drive higher demand for SUI coins, potentially supporting its price for the next breakout.
Inverted Head and Shoulder Pattern Sets a Rally to $3
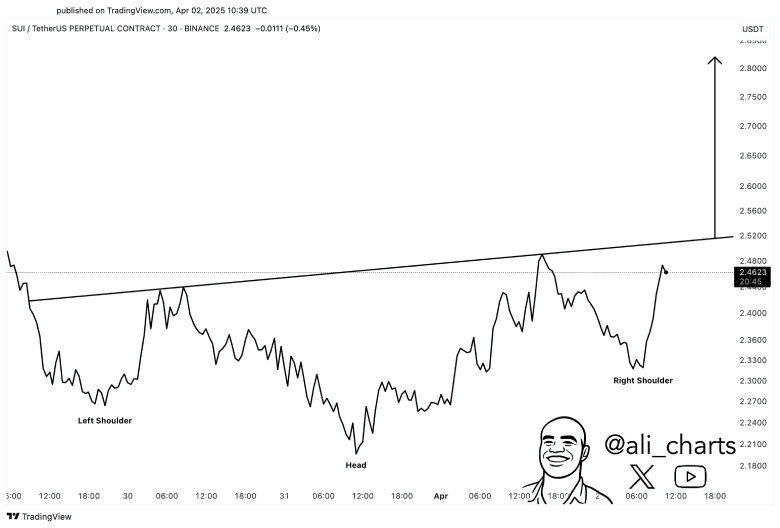
The cryptocurrency market kickstarted April on a bullish note as Bitcoin held its ground above $80,000. As the altcoin market followed this momentum, SUI stood out as it grabbed the attention of crypto analysts due to a potential inverse head and shoulders pattern forming on its chart.
In a recent tweet, renowned trader Ali Martinez highlighted an intraday line chart shows this classic reversal setup, featuring three distinct troughs: the central head flanked by two shallower shoulders. If the pattern holds true, the coin price is poised for 5% and challenges the neckline resistance around $2.5.
A potential breakout could trigger a change in short-term trends and bolster the price rally to $2.8, followed by $3.

However, the SUI price could struggle to hold the $3 floor without broader market support, as major daily EMAs like 100 and 200 defend this level as dynamic resistance.
Also Read: Grayscale Launches 2 Bitcoin ETFs: Will They Boost or Sink BTC Price?


