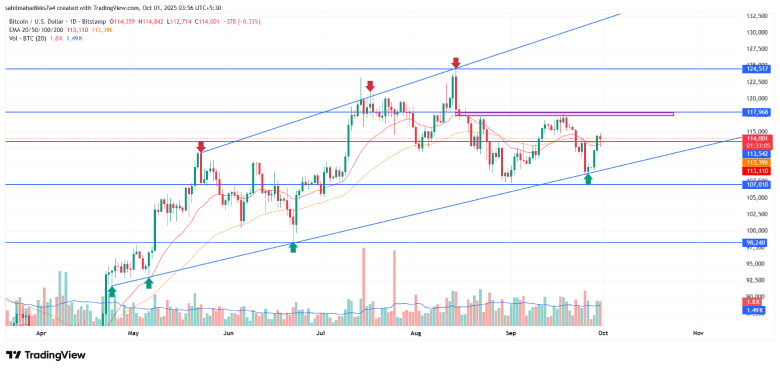
- Bitcoin price analysis shows a potential recovery within the formation of a rising channel pattern on the daily chart.
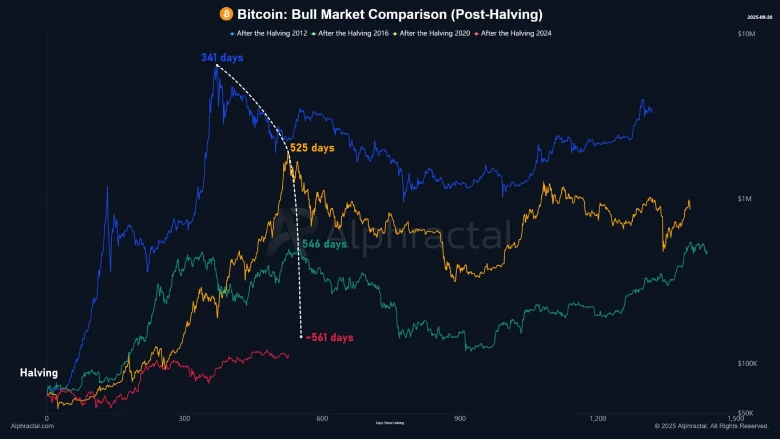
- Bitcoin’s history of previous halving sessions and their associated peaks signals that the current cycle is entering its final phase.
- BTC’s fear and greed index bounced to 50%, signaling neutral sentiment among market participants.
On Tuesday, September 30th, the Bitcoin price retained its bullish outlook, initiated last weekend after a rebound from $108,905. A long-wick rejection candle, accompanied by a 0.22% jump, indicates that the relief rally in BTC is gradually transitioning to a sustainable recovery trend. With investor optimism running high ahead of “Uptober,” market analysts suggest that the pioneer cryptocurrency could be entering the final stage of the current cycle.
Bitcoin Enters Final Stage of Current Cycle
Bitcoin is currently 528 days past its latest halving, which occurred on April 19, 2024. Examining past cycles, the time between a halving and the corresponding all-time high has ranged widely: 371 days in 2012, around 525 days in 2016, and about 546 days in 2020. This rising interval length over time provides insight into how market cycles have changed over time.
Joao Wedson, CEO and founder of Alpharctal, explains that this trend is consistent with several other well-known cycle parameters. Tools such as the Fractal Cycle and the Max Intersect Simple Moving Average (SMA) typically show the later stages of a cycle, indicating that Bitcoin is now entering a phase that precedes a peak phase in history.
If the cycle mirrors previous trends, then the current Bitcoin price rally could peak on October 19, 2025, or 548 days after halving. Extending the interval to 561 days would move the theoretical maximum to November 1, 2025. While these calculations are not predictive certainties, they offer a context for understanding the current stage of the market in relation to the historic cycles.

Joao Wedson emphasized the fact that historical cycles, combined with technical indicators, can give a better view of the cycle in progress. The last few weeks are potentially some of the most important times for Bitcoin, as the cryptocurrency is set to enter the latter period of past cycles.
Bitcoin Price to Extend Its Recovery Within Channel Pattern
Since last weekend, the price of Bitcoin has bounced from $108,652 to the current trading price of $114,300, accounting for a 5.2% jump. An analysis of the daily chart shows this upswing is positioned at the support trendline of a rising channel pattern.
Since late April 2025, the Bitcoin price has experienced a steady uptrend, oscillating between two ascending trendlines of the channel pattern, which have acted as dynamic resistance and support. The history of this pattern shows that the previous reversal managed to rebound 20-22% before facing significant resistance at the channel’s upper boundary.
Amid the recent upswing, the Bitcoin price managed to breach the immediate resistance of $113,500 and reclaim the 20- and 50-day exponential moving average. The coin price holding above the key daily EMAs (20, 50, 100, and 200) restores the prevailing bullish sentiment in the market. This breakout could bolster another 3.5% jump and push the price against the monthly resistance at $118,000.
A bullish breakout from this resistance will further intensify the buying momentum and potentially extend the bull cycle with this channel to $134,000.

Alternatively, the BTC price could prolong its short-term consolidation if sellers continue to defend the $18,000 level. The lateral trade puts the price at risk of the channel pattern breakdown, which would signal a deeper correction ahead.
Also read: Ethereum Spot ETF Sees $547M Inflow, Market Sentiment Improves


