The cryptocurrency market recorded no major movement during the Friday U.S. market session, as evidenced by the short body candle in Bitcoin. The current market trend remains bearish amid the ongoing tariff war among major nations, signaling the risk of prolonged further correction. Among the top altcoins, the Chainlink price faces a potential breakdown in the near term as large-scale investors are dumping their hold.
Key Highlights:
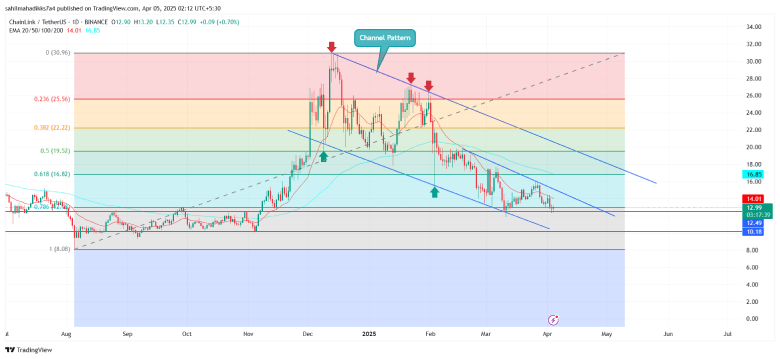
- A sustained correction trendline within the channel pattern could push the Chainlink price below $12.
- A recent breakdown below the 20-day EMA reinforces the seller’s grip over this asset and drives a further fall.
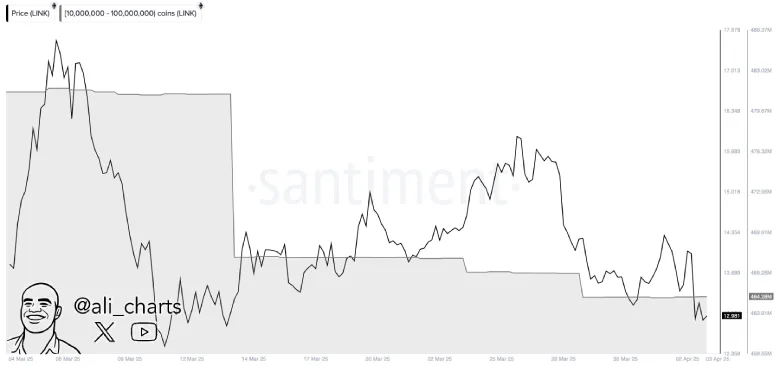
- On-chain data reveals over 170 million LINK tokens have been offloaded by whales in the past three weeks.
Chainlink Faces Breakdown as Whales Dump Tokens
LINK, the native cryptocurrency of the decentralized Oracle network Chainlink, currently seeks support at the $12.5 floor. However, this support coincides closely with the 78.6% Fibonacci retracement level, indicating the asset has witnessed a significant breakdown in value, suggesting a weakness in buyers’ conviction.
Adding to the bearish note, the on-chain data reveals that whales have offloaded more than 170 million Chainlink (LINK) tokens over the past three weeks.

The accompanying chart from crypto analyst Ali Martinez shows a steep decline in holdings among addresses owning between 10 million and 100 million LINK tokens. This trend indicates that large holders are reducing their exposure to the asset, likely in anticipation of a prolonged downfall.
Channel Pattern Governs LINK Price Correction
In the last two weeks, the Chainlink price shows a V-top reversal from $19 to the current trading value of $12.97, registering a 19% loss. The daily chart shows this downtrend is actively resonating within two parallel trendlines, revealing the formation of a channel pattern.
As the dynamic resistance support guides the price lower, the LINK price is poised for a bearish breakdown below $12.5 support. A successful flip of the bottom support into resistance could strengthen the seller’s grip over this asset to drive a 20% fall and test the $10 floor.

However, as no trend remains the same in a tradable asset, the coin price is poised to challenge the overhead trendline. This potential breakout will signal a change in market dynamics and bolster buyers for a counterattack.
Also Read: Solana Forms Bullish Setup Amid S-1 Filing for Grayscale SOL ETF—Is $150 Close?


