- The Ethereum price rides a mid-term correction trend within the Flag pattern.
- Overhead supply at $4,245 could push the ETH price 9% lower before acquiring stable support.
- On-chain data signals ETH Buy/Sell Pressure Delta has slipped into the negative zone, suggesting a temporary dominance of sellers over buyers.
The cryptocurrency market recorded a slight rebound on Wednesday, following the Federal Reserve’s quarter-point interest rate cut. As a result, the Bitcoin price stabilized above $110,000, while the Ethereum price shows notable resilience above $3,900, forming a neutral candle. While a shift in trend is yet to be confirmed, the ETH Buy/Sell Pressure Delta has turned negative, and on-chain volume is starting to drop. Here’s what these metrics hint at for Ether’s potential in the future.
ETH On-Chain Data Shows Potential Turning Point Amid Weak Market
Ethereum’s recent on-chain readings suggest that the underlying market dynamics may be changing, although the selling pressure seems to be most apparent in short-term sentiment.
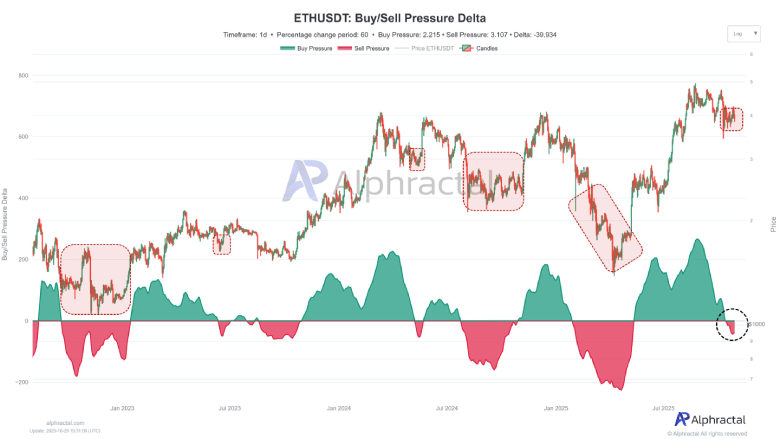
In a tweet, the on-chain analytics platform Alphractal highlights that ETH’s Buy/Sell Pressure Delta (a measure of bullish vs. bearish transaction activity) had recently entered the negative region. Theoretically, this may indicate that the sellers are momentarily stronger than the buyers in the short-term trend. The indication isn’t as straightforward as the historical data shows two possible outcomes of this occurrence.
In multiple instances in the past where this delta had dipped below zero, the price of Ethereum was already near cyclical lows, often ahead of a rebound once the sell-side activity died down. Only if the metric fell sharply into deep negative territory—as was the case during a long period of time between February and April—did it correspond to prolonged phases of bearishness. Current readings are still well away from those extremes.
The dataset also shows an obvious decrease in the on-chain transaction volume, in terms of the U.S. dollar value of ETH transfers. Declining activity levels tend to match periods of declining public engagement or fatigue in the aftermath of volatile market cycles. Analysts point out that these quiet periods have historically been followed by renewed periods of accumulation and renewed price action.
While the overall sentiment across the crypto markets is still subdued, the chart from Alphractal highlights that Ethereum’s network fundamentals are not showing signs of extreme stress. Instead, what is occurring could be a transitional stage rather than a continuation of heavy distribution: the combination of modest sell-side dominance and softening activity.
Ethereum Price Extends Correction Within Flag Pattern
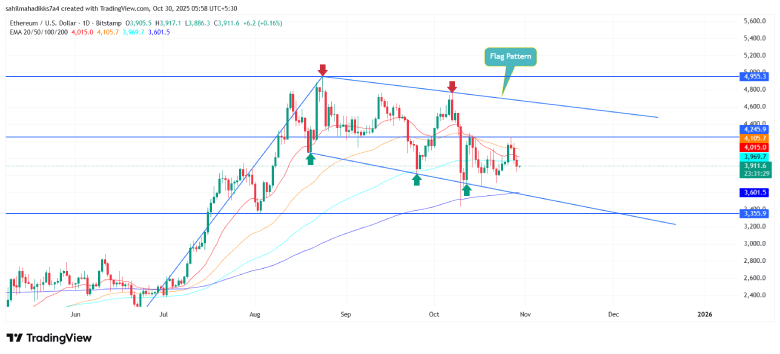
Despite market optimism surrounding the Fed rate cut, the Ethereum price shows a bearish reversal from $4,252 to $3,897—an 8.3% decline in the last three days. The pullback indicates intact overhead supply and a risk of continued consolidation in the near-term trend.
If the selling pressure persists, Ethereum could plunge another 9% before retesting the bottom trendline of a bullish flag pattern at $3,555. This chart setup is commonly observed within an established uptrend, as it allows buyers to recoup the exhausted bullish momentum.
If the pattern holds true, a potential retest of the lower trendline has often encouraged the price for a bullish rebound of over 20%. The 200-day exponential moving average wavering around the aforementioned support accentuates the possibility of a potential recovery.

However, the buyers must breach the key resistance end of this pattern to confirm the bullish trend.


