Ethereum, the biggest altcoin in the market, continues its silent trend with a valuation of $2,21 billion. Despite a price surge of nearly 3% over the past 24 hours, the recent Pectra upgrade has failed to result in a highly anticipated bullish move.
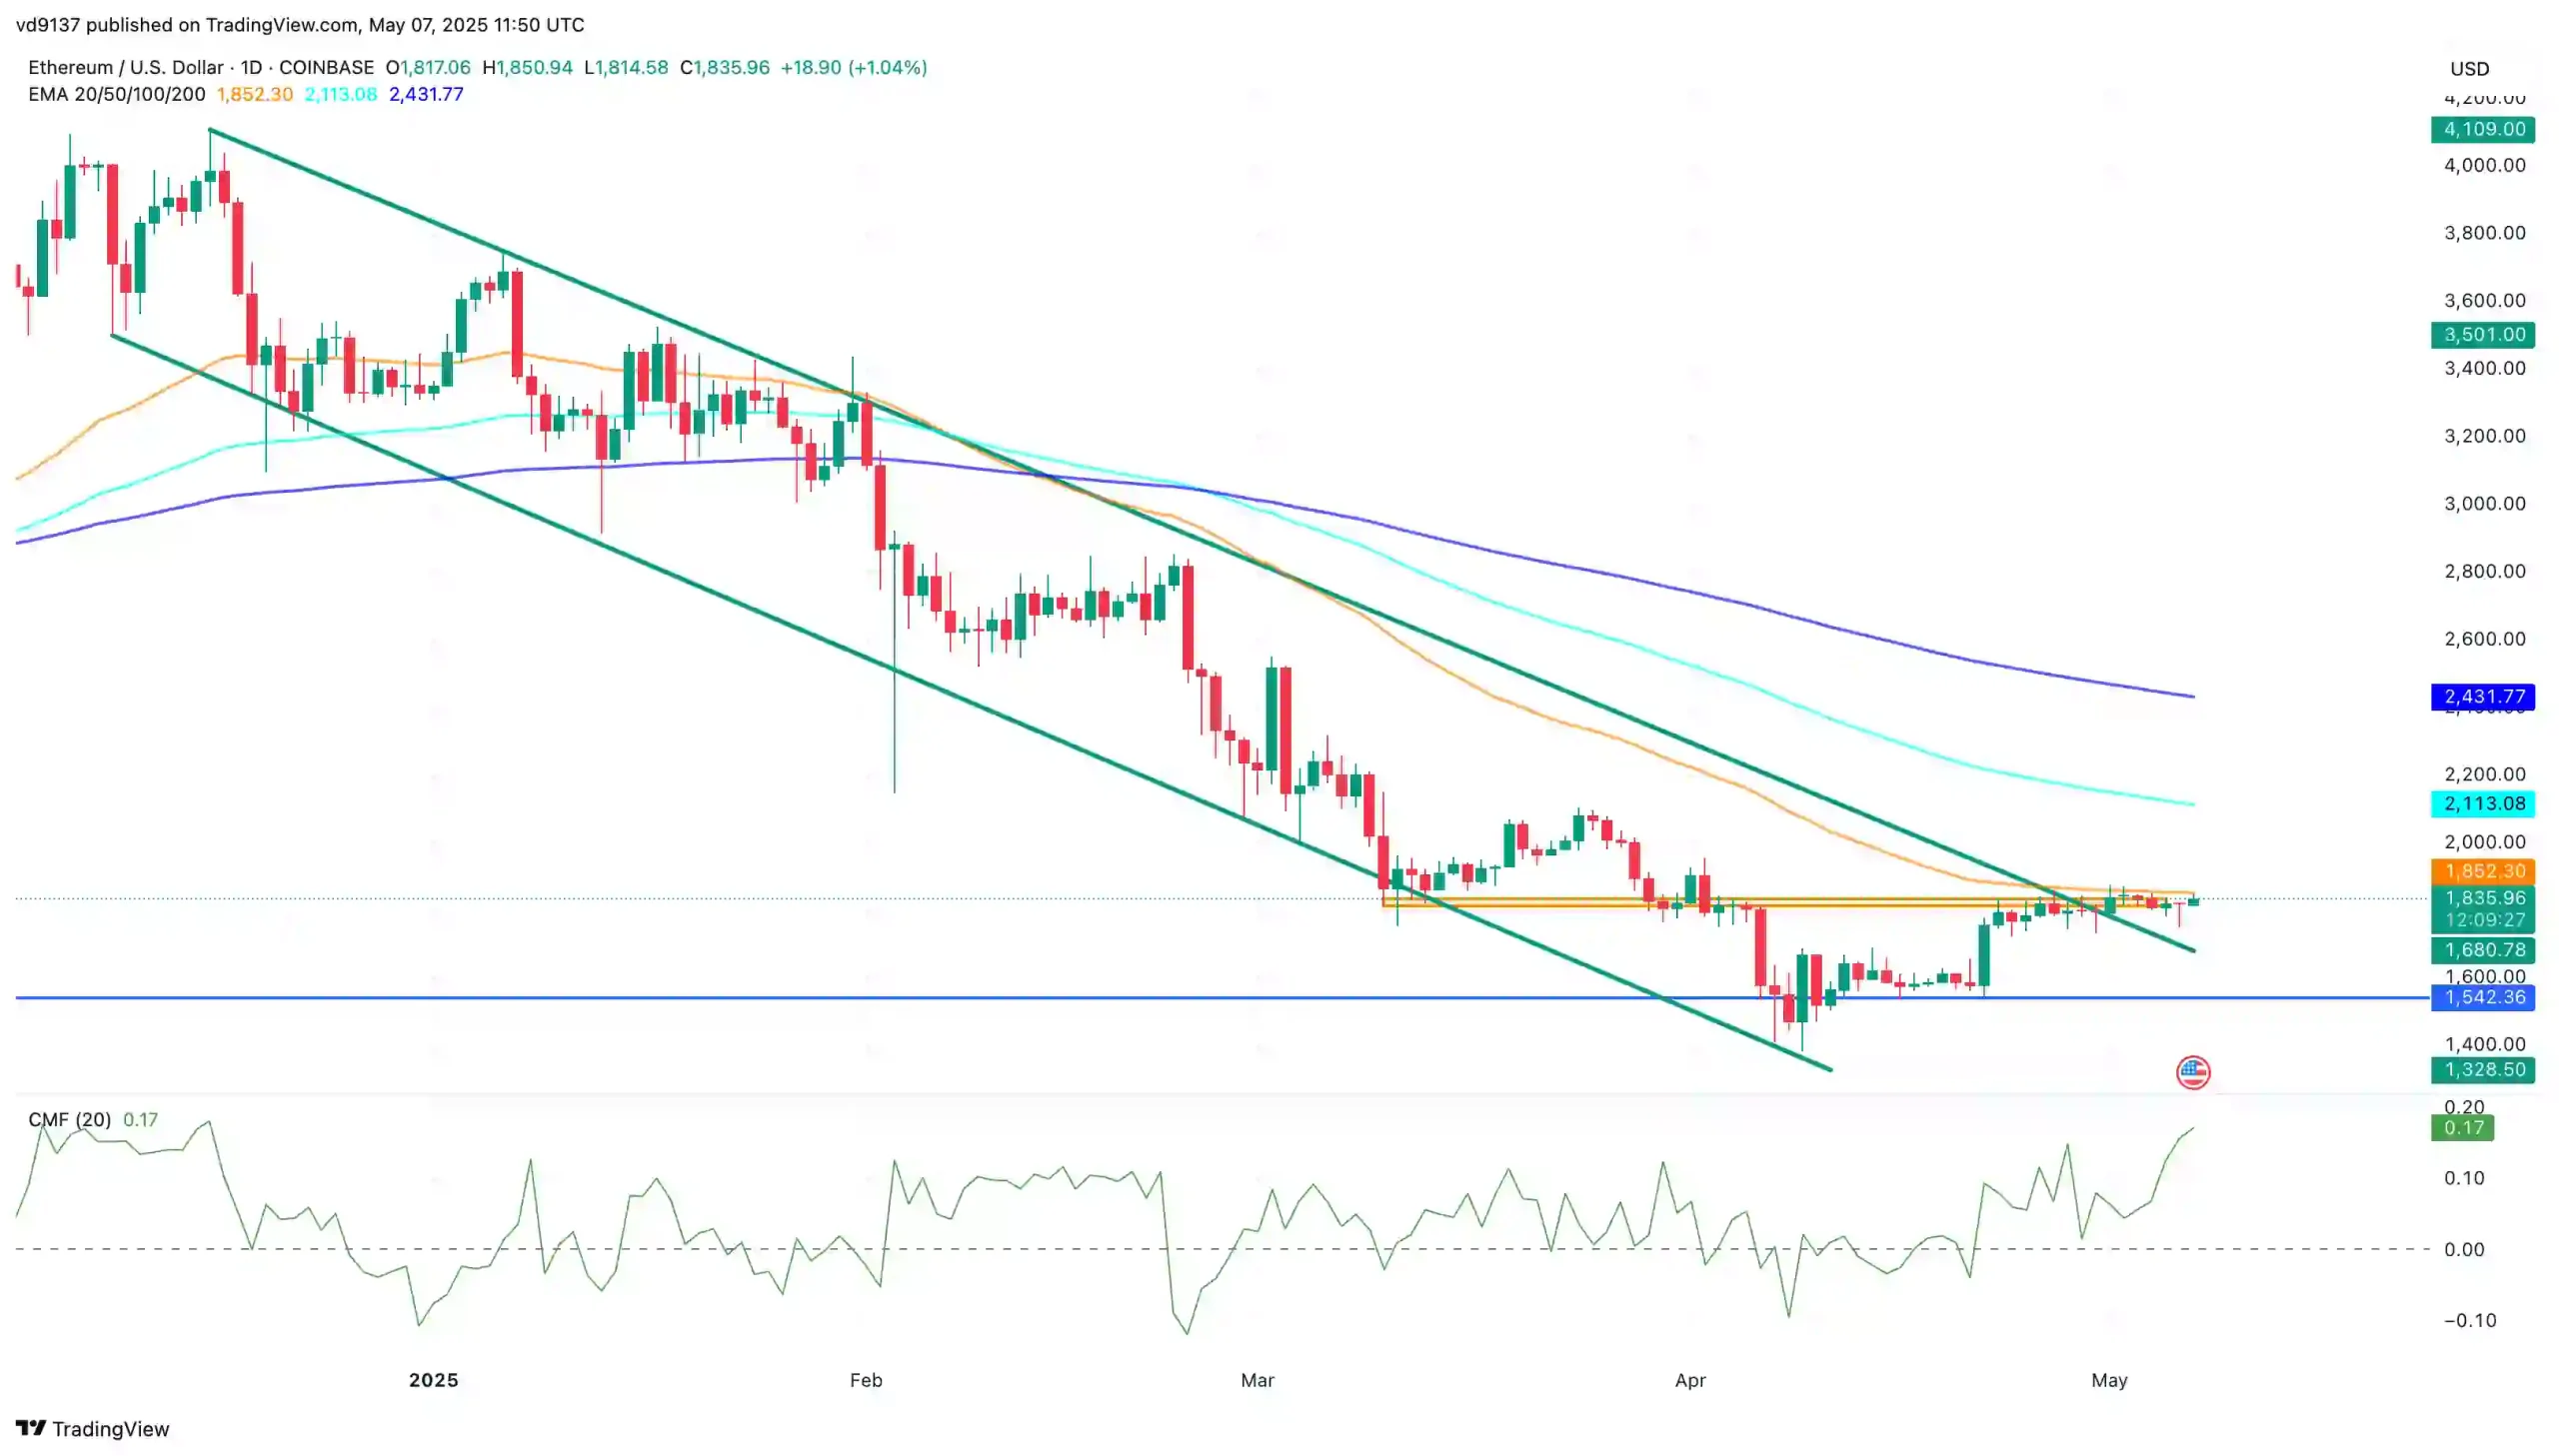
Currently, Ethereum trades at $1,836 and struggles to bounce back after the recent falling channel breakout. Will the broader market recovery and the Pectra upgrade help the Ethereum price trend regain a bullish stance? Let’s find out.
Ethereum Price Targets 30% Hike With 50-day EMA Breakout
Ethereum recently escaped the declining trend within a falling channel pattern with a breakout on May 1st. The price surge of 2.51% created a bullish and guilty candle and marked the breakout of a long-standing resistance trendline.

However, the highly expected bullish trend after the breakout failed to appear in the Ethereum chart. Currently, Ethereum trades under the 50-day EMA line, respecting its dynamic resistance.
However, the broader market now anticipates a post-retest reversal in the Ethereum price trend. The Chaikin Money Flow Index supports the possibility of a bullish trend as it spikes to 0.17. With the positive money flow and broader market recovery, Ethereum could witness a bullish run.
However, the altcoin must surpass the immediate resistance of the 50-day EMA line at $1,852. In case of a bullish breakout, the immediate resistance is the 100-day EMA line at $2,113, followed by the 200-day EMA line slightly above the $2,400 mark.
Thus, the dynamic average lines point out a possible 30% surge if Ethereum exceeds $1,852. On the flip side, the crucial support remains the $1,500 psychological mark.
Fidelity Becomes The Only Outflowing Ethereum ETFs on May 6
On May 6, the U.S. Ethereum spot ETFs recorded a net outflow of $1,7.87 million. The majority of the ETFs maintained a net-zero flow, while Fidelity remained the sole outflowing ETF.
Currently, the total net assets held by the U.S. Ethereum spot ETFs account for $6.81 million, which is 2.88% of the Ethereum market cap.
Short Position Spike Ethereum Price Drop
The derivatives market remains pessimistic on Ethereum as the data from CoinGlass reflects a surge in bearish positions. The Ethereum Long-to-Short Ratio chart reveals a surge in short positions, reaching 54.7%, dropping the Long-to-Short Ratio to 0.8282.
As the derivatives market becomes marginally bearish-dominated, the sentiments are gradually deteriorating.


