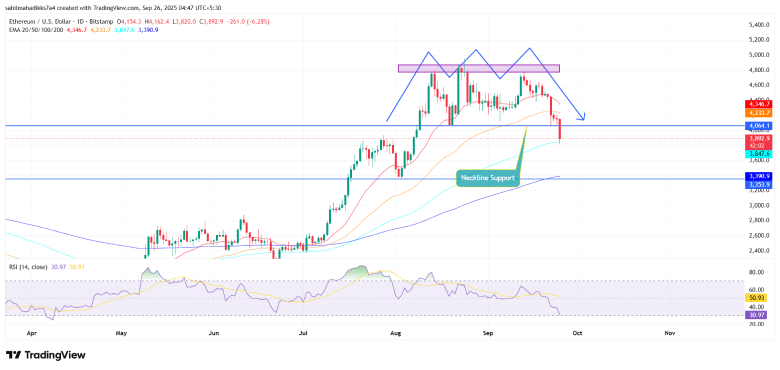
- Ethereum price gives a decisive breakout below the neckline support of the triple-top reversal pattern.
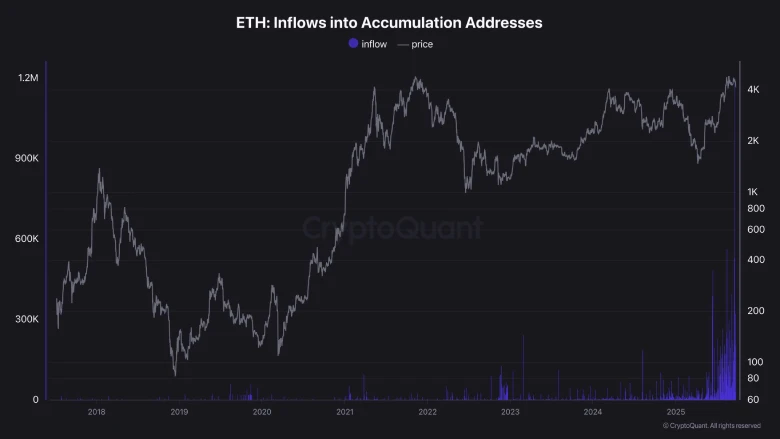
- The ETH accumulator addresses show aggressive buying amid the market correction, as they accumulated over 400k ETH just yesterday.
- ETH price holding above the 50% Fibonacci retracement mark indicates that the current correction is within the healthy range for uptrend continuation.
On Thursday, September 25th, the crypto market witnessed a sharp sell-off as concerns about a potential U.S. Government shutdown triggered broader market uncertainty. As a result, the Bitcoin price dived below the $110,000 floor, while the second-largest cryptocurrency broke below the $4,000 support. The technical chart highlights that the recent breakdown in Ethereum price completed a common reversal pattern, signaling the risk of further decline. Despite the mounting bearish outlook, ETH’s accumulator addresses show strong conviction as they continue to stack more Ether.
ETH Hits Historic Accumulation as 1.2M ETH Goes to Long-Term Wallets
Ethereum has seen one of its greatest accumulation phases on record, as new data indicates a flurry of new inflows into addresses that appear to have zero sell-off activity.
Market analyst Darkfost pointed out that wallets known as “accumulators” had absorbed almost 400,000 ETH in a single day this week. These accounts, characterized by repetitive inflows of Ether without any record of outflows or sales, broke a new mark earlier in the month, with the level of daily inflows reaching 1.2 million ETH on September 18th. The activity was the largest single-day spike ever seen among this kind of Ethereum holder.
Such addresses are regarded as a sign of long-term positioning, as they continuously accumulate on their balances without returning coins to the market. Analysts note that the timing coincides with growing institutional interest around ETH, particularly through the expansion of exchange-traded fund (ETF) products tied to the asset.

Additional numbers from the on-chain data tracking platform Lookonchain reinforce the bullish narrative. According to their update, 295,861 ETH—worth around $1.19 billion—were sent to the wallets within a 24-hour period. The transfers were traced back to large service providers such as Kraken, Galaxy Digital OTC, BitGo, and FalconX, indicating fund transfers both within the cryptocurrency exchange and over-the-counter.
Taken together, these observations give us a snapshot of the recent supply dynamics of the Ethereum ecosystem, where large volumes are moving into the wallets of long-term holders.
Ethereum Price Gives Decisive Breakout From Reversal Pattern
In the last two weeks, the ETH price witnessed a sharp correction from $4,768 to the current trading price of $3,931, projecting a 17.5% loss. Subsequently, the asset’s market cap plunged to $470.02 billion.
A look at the daily chart shows this pullback as the third rejection from the overhead supply zone of $4,800, indicating the formation of a three-top reversal pattern. The chart setup is commonly spotted at the end of an uptrend, as it bolsters a correction momentum in price.
With today’s fall of over 6%, the Ethereum price gave a decisive breakout from the pattern neckline support of $4,064. The breakdown coincides with a sharp dip in the momentum indicator RSI to the 30% region, accentuating the bearish sentiment in the market.
If the breakout holds, the Ethereum price could plunge another 14% and test the $3,354 support.

Despite the risk of potential breakdown, the ETH price still holds above the 50% Fibonacci Retracement Ratio, currently priced at the $3,150 mark. Historically, this level has acted as a strong support level for buyers to recoup the exhausted bullish momentum.
Also Read: Hashdex Expands ETF to Include Five Crypto, Including SOL


