


ETH, the native cryptocurrency of the smart contract giant, Ethereum, surged 4.5% during Monday’s U.S. trading session. Along with the broader market recovery, a notable growth in new ETH users and weak resistance in the buyers’ path show a potential upswing ahead. This renewed recovery in the current consolidation zone suggests a bullish breakout is in the making. Is the $3,000 really close?
Ethereum Network Sees Renewed Interest in New Users
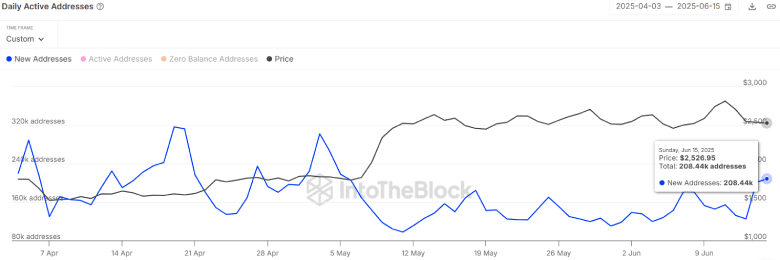
Since mid-May, the Ethereum price has been consolidating in a narrow range formed by two slightly ascending trendlines (as shown in the chart below). The coin price bounced several times between the two trendlines, indicating a lack of conviction from both buyers and sellers.
Despite the uncertainty, the number of new addresses on the Ethereum network jumped from 124.5K to 208K—a 67% increase—since last week. This surge often implies increased adoption, a potential uptick in DeFi or NFT engagement, and a possible bullish sentiment building around Ethereum. If the trend continues, the ETH price is expected to experience a surge in bullish momentum.
Additionally, on-chain data from IntoTheBlock analytics indicates that weak resistance is hindering the buyer’s path to an uptrend. The recent data from Global In/Out of the Money shows that the region from $2,800 to $3,256 holds a 5.32 million ETH volume among 13.45 million addresses. Moreover, the region around $3,256 to $3,544 holds 3.44 million ETH from 12.79 million addresses.

These supply zones are marked by small red circles, indicating lower selling pressure compared to the stronger support regions below.
ETH Price Nearing Major Breakout Amid Reversal Pattern
The Ethereum price analysis of the daily chart reveals its current consolidation as part of a well-known reversal pattern called the inverted head and shoulders pattern. The chart setup is characterized by three troughs: a left shoulder, formed by an initial decline and a minor rebound; a head, created by a deeper price dip and a sharp V-shaped recovery; and a right shoulder, which mirrors the initial dip before a major breakout.
The ETH price holding its ground above the 50-and-200-day EMA slope accentuates the asset’s broader trend in bullishness. Thus, if the pattern holds true, the coin price could be bound 11-13% to challenge neckline resistance at $2,840 to $2,900.

A successful breakout will accelerate the bullish momentum and push the coin towards $4,200.
On the contrary, the breakdown below the 50-day EMA could invalidate the bullish pattern.
Also Read: JPMorgan’s Crypto U-Turn: Trademarks JPMD for Crypto Service
