Ethereum, the second largest cryptocurrency by market cap, bounced 2.65% on Monday to trade at $1,634. The surge in buying pressure can be attributed to easing market uncertainty surrounding united reciprocal trade.
While the market momentum is yet to confirm trend reversal, the increasing ETH accumulation from whales signals an early sign of bottom formation and bullish resurgence.
On-Chain Data Reveals Whale Confidence at $1,630 Level
Last week, the cryptocurrency market witnessed a bullish turnaround after the U.S. President Donald Trump announced a 90-day suspension on reciprocal tariffs on over 75 countries. In response, the ETH price bounced from a $1,411 low to currently trade at $1,630, registering a 15.53% growth. According to the latest on-chain data, the current recovery is now being fueled by renewed whale activity, signaling growing confidence and an opportunity for a stronger rally.
According to Lookonchain, a high-net-worth entity deposited $6 million worth of USDC into the decentralized perpetuals exchange Hyperliquid, opening a 5x leveraged long on ETH at $1,624.44.
The move suggests strong bullish conviction at current price levels, while the broader market is yet to confirm trend reversal broader
Simultaneously, another aggressive whale maneuver was spotted involving 15,953 ETH—valued at $26.16 million—withdrawn from OKX by a cluster of six wallets, which Lookonchain suspects belong to a single institutional player. These funds were redirected to Aave, a decentralized lending platform, to borrow $15.4 million USDT and swiftly redeposited into OKX, potentially to buy more ETH.
Wedge Pattern Suggests Ethereum Nearing Breakout Point
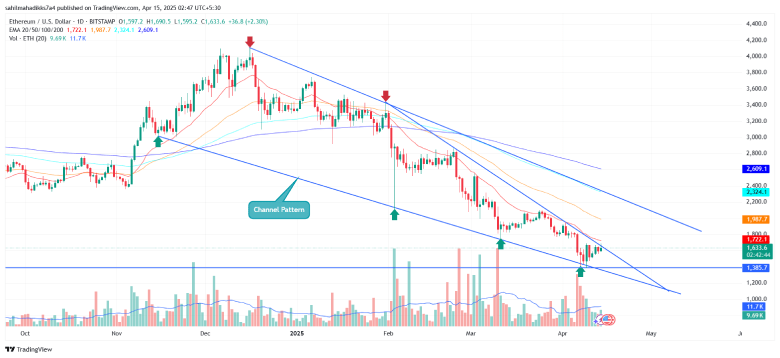
The daily chart analysis of the Ethereum price shows a long wick rejection candle at the combined resistance of a downsloping trendline and 20-day EMA. Since late December 2024, the coin price has struggled to sustain itself above the dynamic resistance of the EMA slope, as the previous reversal led to accelerated selling pressure and a prolonged downfall.
Therefore, if the overall selling pressure persists, the ETH price would likely plunge 18% and test the support trendline of the wedge pattern at $1,314. However, the current price structure suggests Ethereum is nearing the apex of this wedge — a point historically known to precede breakout moves.

If the coin price breaks overhead resistance with a daily candle, the buyers could drive a 35% rally, propelling ETH toward the multi-month resistance level of around $2,000.
The aforementioned level is a crucial pivot point for Ethereum, as it can trigger a renewed recovery trend or extend the correction fall.
Also Read: Canada’s Solana Spot ETF Approval Fuels SOL Recovery For $200 Breakout


