


ETH, the native cryptocurrency of the Ethereum ecosystem, witnessed heightened volatility during Thursday’s U.S. market hours. The daily chart showed a notable price spread from $3,508 low to $3,775 high, while the candle body is short to reflect market uncertainty. However, the Ether maintains its overall bullish trend amid BlackRock’s investment and significant inflow. Is the top altcoin ready for the next breakout?
Ethereum BlackRock ETF Sees Meteoric Rise to $10B
Over the past three weeks, the Ethereum price showcased a parabolic surge from $2,374 to a recent high of $3,859.3, representing a 62.5% gain. Amidst the regulatory developments in the US, a notable catalyst behind this surge was a massive influx into Ethereum’s exchange-traded funds.
In a recent tweet, Eric Balchauns highlights that the Ethereum Blackrock ETF (ETHA) has hit a $10 billion mark in just one year, becoming the third fastest ETF to hit this milestone in history, after the two Bitcoin ETFs IBIT and FBTC. The only two ETFs to surpass this feat are the two Bitcoin-based ETFs, IBIT and FBTC.
Interestingly, the fund surged from $5 billion to $10 billion in just 10 days, which Balchunas mentioned was the “ETF asset equivalent of a god candle,” highlighting the intense investor interest in Ethereum-based products.
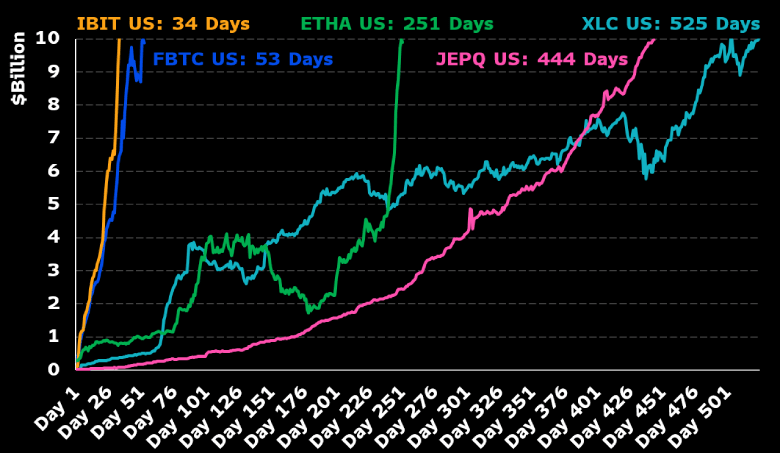
ETHA now ranks in the Top 5 for flows in 1-month and 1-week periods, further solidifying its position in the ETF market.
ETH Price Flag Breakout Hints Continued Recovery
Earlier this week, the Ethereum coin entered a short-term correction, which plunged its price from $3,589 to a recent low of $3,500, registering a 9% drop. A look at the 4-hour chart revealed this pullback as the formation of a renowned bullish continuation pattern called a bull flag. With an intraday gain of 2.7%, the buyers gave a decisive breakout from the pattern’s upper boundary, signaling the continuation of the bullish pattern.
This correction showcases a bullish reversal from the 50-day exponential moving average, typically indicating a healthy pullback for buyers to recuperate bullish momentum.
Furthermore, the 4-hour candle shows a long-tail rejection in its retest candle, indicating the intact demand pressure post-breakout.
If the pattern holds true, the ETH price could rally another 6% to challenge $3,973 resistance, followed by a leap to $4,100.

On the contrary, if the coin price fails to surpass the immediate resistance of $3773, the seller could maintain a lower-high formation in the chart, threatening a prolonged correction trend in the near future.
