


ENA, the governance token for the Ethena protocol, declined by over 7.5% during Thursday’s market session, trading at $0.289. The selling pressure likely followed a broader market correction as Bitcoin recorded a 3.3% decline. While the Ethena price shows potential for prolonged correction, its sustained recovery in total volume locked (TVL) accentuates an opportunity for bullish reversal.
TVL Growth Reflects Confidence in Ethena Ecosystem
On Thursday, June 5th, the crypto market witnessed a sudden sell-off following Bitcoin’s drop below $102,000. The bearish momentum quickly spread to the altcoin market, renewing the short-term correction trend.
Thus, the Ethena price plummeted to the $0.285 level, extending its three-week loss to 38.5%. The declining trend in daily EMAs (20, 50, 100, and 200) accentuates the bearish momentum and potential for further downfall.
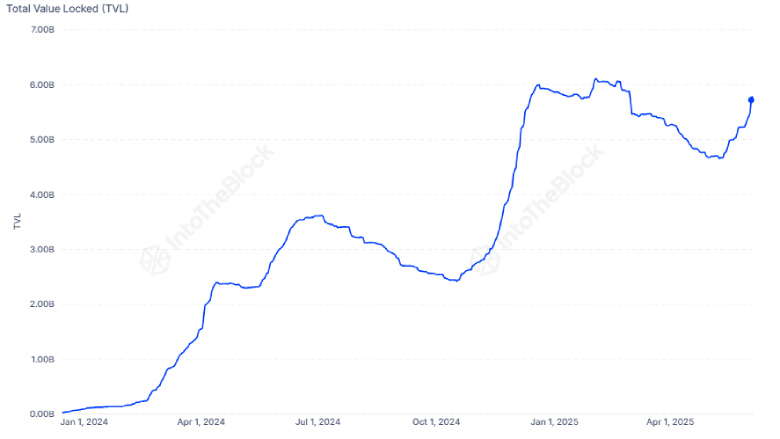
Despite the price correction, Ethena’s TVL has showcased impressive growth and is steadily nearing its all-time high of $6.1. Typically, the rising TVL highlights investors’ confidence in the platform’s ecosystem as more funds are locked into its DeFi services.
This surge in TVL is coinciding with a steady rise in holders, as more than 10,000 wallets have added ENA tokens since January. Additionally, the platform has seen the addition of around 2,800 new holders of USDE, a synthetic dollar stablecoin within the Ethena ecosystem.
In addition, the largest crypto exchange in the U.S., Coinbase, has announced its support for Ethena trading with the ENA-USD pair.
These developments suggest that Ethena’s infrastructure and tokenomics are gaining traction among crypto participants and could bolster buyers to renew bullish momentum.
ENA Price Eyes Recovery With This Reversal Pattern
The Ethena price is currently seeking support at the weekly low of $0.287. If the level holds, the coin price will undergo a short consolidation before rebounding to a higher level. The potential reversal could push the asset 52% up amid the formation of an inverted head and shoulder pattern.
The chart setup is commonly observed in major market bottoms and drives a fresh recovery force in price. However, with current market sentiment, the bullish reversal is on thin ice. Therefore, a bearish breakdown below $0.287 will drive a 12% fall to test the multi-month support level of $0.255.

This support has acted as a major accumulation zone for buyers and countered the ongoing downtrend.
Also Read: China’s Webus Files With SEC for $300 Million XRP Treasury Plan
