

- The Dogecoin price exits the current correction trend with a bullish breakout from a triangle pattern.
- On-chain data highlights a steady rise in supply held by short-term holders (STH), signaling a potential for renewed recovery.
- The DOGE price could face in-between resistance at $0.255 and $0.286 before extending its recovery above the $0.3 mark.
DOGE, the largest main cryptocurrency by market cap, jumps 2.53% during Monday’s U.S. market to trade at $0.234. The buying pressure came along with a relief rally in the crypto market and renewed accumulation from short-term holders (STH). The rising Dogecoin price also offers a bullish breakout from the resistance trendline of a consolidation phase, signaling increasing bullish momentum. Will the coin price surge towards the $0.3 mark?
DOGE Supply Shift Signals Renewed Short-Term Holder Activity
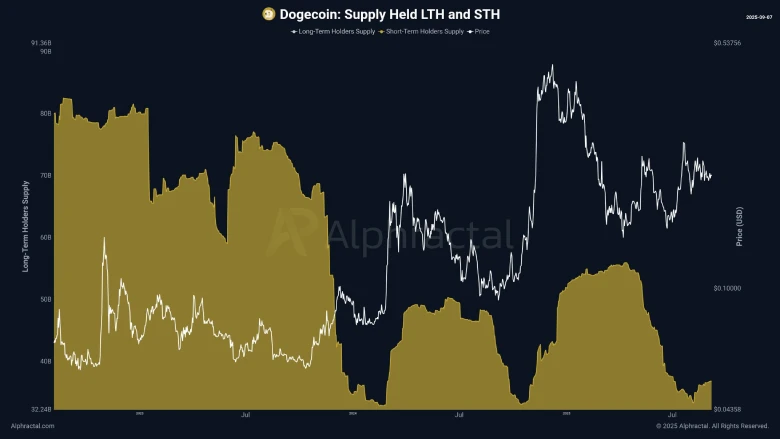
Recent blockchain data shows a notable shift in the behavior of Dogecoin investors. The chart below highlights a steady rise in the proportion of supply dominated by short-term holders (STH), which in previous cycles has been accompanied by accelerated price rallies of the trending meme-based cryptocurrency.
Historically, Dogecoin has responded violently when the coins found their way into the hands of new entrants. Every spike in ownership of STH has coincided with a strong bullish momentum, accentuating times of high growth rate.
Analyst Joao Wedon, monitoring the metric, notes that the present increase, which has unfolded over the past few weeks, may suggest that accumulation is already in process across speculative wallets.
On-chain research group Alpharactal charts indicate that the relative position between long-term holders (LTH) and STH is changing. As LTH still dominates most of the supply, the recent rise in short-term activity indicates a re-entry into the market. The volatility can be very high in this dynamic, where traders who take positions in less time can increase both down and up movements.
Analytics also warn that volatility will always be a part of crypto-trading. Although the general market factor has been characterized by periodic retreats in recent days, analysts emphasize that the wavelike trend is common.
Dogecoin Price Exits Major Consolidation with Triangle Breakout
Over the past seven weeks, the Dogecoin price has shown a short-term sideways trend confined within the $0.2875 and $0.188 levels. A deeper analysis of the daily chart shows this price consolidation resonated actively within two converging trendlines, indicating the formation of a symmetric triangle pattern.
The coin price bounces thrice from either trendline, indicating its strong influence to bolster the trend trajectory. Amid this lateral trend, the 100-day exponential moving average crosses above the 200-day EMA. Historically, this positive crossover has signaled a long-term bullish shift in market momentum.
The momentum indicator RSI (Relative Strength Index) shows an upward incline to 57%, signaling a renewed bullish sentiment. On September 7th, the Dogecoin price gave a bullish breakout from the pattern’s resistant trendline at $0.225. The 2.5% intraday surge today offers a suitable follow-up to the recent breakout signaling the intact demand pressure.
With sustained buying, the post-breakout rally could challenge the immediate resistance of $0.255, followed by a breakout from $0.286. If the coin price manages to sustain these levels, the current recovery could extend high above the $0.3 psychological level.

On the contrary, if the coin price reverts and re-enters the triangle range, Dogecoin’s bullish momentum could face a risk of invalidation. In a pessimistic scenario, the price could break below the 200-day EMA.
Also Read: BRETT Coin Price Bounces Back: Will It Break Through $0.1?

