



Like other cryptocurrencies, Dash began to rise at the beginning of the year and reached its recent high of $476, forming resistance. The coin was consistently in the growth phase with a return of almost 630% in a time span of 5 months.
The price fell rigorously from the May to July period, from highs of $476 to lows of $108, and reached its support zone, giving the investors hope for a bullish move for the future if the fundamentals and technical parameters are in favor. From July 19 onwards, the coin moved upwards after being rejected from the support line. In the July to August period, the coin gave a return of 110%.
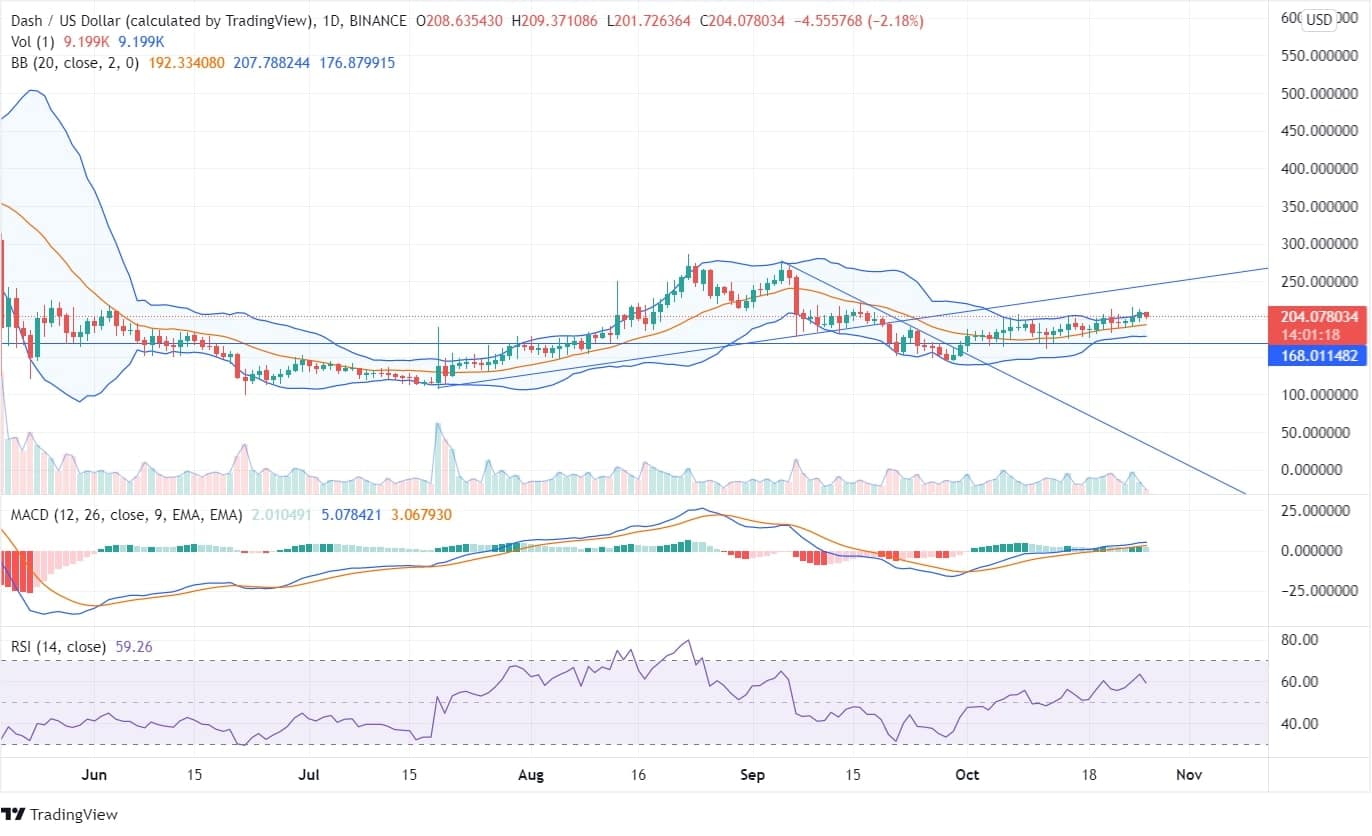 In the current scenario, the DASH price is moving in consolidated momentum. In the daily chart, the MACD line is above the signal line, indicating a bullish move of price with green candles in the histogram chart. There is a bullish divergence between the price and the MACD indicator, indicating bullish momentum of the price.
The breakouts of triangle patterns can be an indication of bullish sentiment provided the price crosses the recent highs of $222. The price is moving on the upper bands of Bollinger, and the bands being contracted show very low volatility in the market.
The RSI is at 58 and is neutral for any prediction, though it has risen from its oversold zone and may reach resistance.
In a time span of 12 to 15 weeks, the price fell majorly from its resistance zone. From $476 and made its new resistance of $285. The weekly chart is showing a downtrend pattern, but bullish candles have been formed since September 27, with higher highs and lower lows. The MACD indicator shows the MACD and the signal line overlapping each other, being in the neutral zone.
The candlesticks have uplifted from the support zone and may reach the recent high of $285. There is not much rise in volume. The bullish investors may push the price up to its resistance level in the future if it breaks the high of $285. The bands being broad show volatility in the crypto market, indicating a strong price move in the future if the bulls are optimistic.
Looking at the longer-period charts, bullish momentum can be expected in crypto, and the DASH may reach its all-time high in the long run.