As the crypto market witnesses a surge in bullish momentum, Chainlink prepares for a major breakout move. Outgrowing a bearish pattern, Chainlink witnesses a surge in inflows.
Crossing above $13, Chainlink aims to take off to the $20 mark. Will the channel breakout lead to a new swing high in LINK prices?
Chainlink Price Breaks Descending Channel
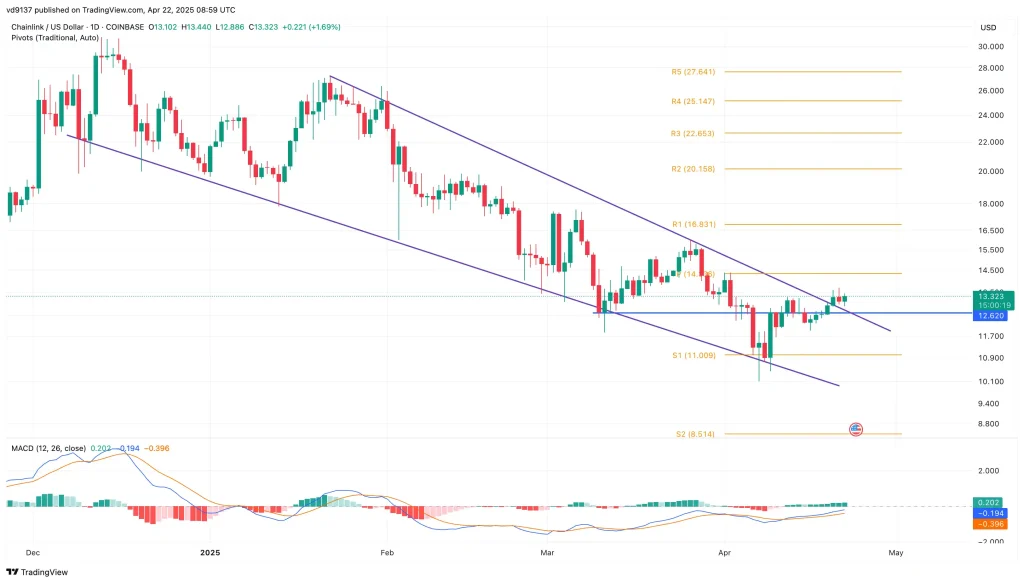
The investor confidence for Chainlink seems to have translated into a positive breakout as the crypto market recovers. LINK has been moving within a descending channel and has resistance at $14.26 (R1) and support at $12.62.
At present, Chainlink is trading at $13.32, having recovered slightly. The Chainlink price has been unable to rise above that resistance level of 14.26, which has been a solid barrier since late 2024. If it breaks above here, it could be taken as a bullish reversal for LINK.

Moreover, this chart shows some significant pivot points. If LINK moves beyond R1, R2 at $16.83, and R3 at $20.16, they may become important levels. But, otherwise, if LINK does not break the resistance, it may consolidate further, again possibly retreating to support level S1 at $11.01 or S2 at $8.51.
MACD Indicator Shows Weak Bullish Momentum
While the MACD line (blue) indicates that the price is generally above the signal line (orange), the histogram remains below zero, which indicates that the bullish momentum is weak. This kind of mixedness reflects the general dynamics of the market.
There is an accumulation of investors, clearly seen from the outflows, but lacking any strong momentum to push the price up further. Accumulated thus, but be careful because currently, the market shows no strong upward momentum.
Ongoing Accumulation Phase with $120 Million in Outflows
Chainlink ($LINK) has been experiencing a continuous trend of outflows from exchanges, signaling potential accumulation by investors. Between March 22 and April 21, 2025, on-chain data from IntoTheBlock revealed significant fluctuations in LINK’s flows.
The data shows that LINK’s net outflows peaked at 713.2k LINK on March 22, before stabilizing at 356.6k LINK by April 9. By April 17, the outflows had once again reached 356.6k LINK, indicating a consistent pattern of moving tokens off exchanges.
The perpetual outflows recorded during the past thirty days of LINK might not be indicative of LINK holders offloading their assets but possibly thinking of freezing their tokens into cold storage in order to adopt a long-term holding strategy. The behavior often tends to correlate with increasing confidence in the future prospects of a token.
Thus, it makes one investor’s elbows prefer holding and not cashing out. During this specific time, LINK has traded from $12.00 to $13.500 with respect to its price movements against flows.
On April 3, as LINK outflows reached 713.2k, the price moved up from $12.50 to $13.00. This suggests that outflows might create a supportive effect on the price of the token.
Now, on April 21, with more than $120 million in total net outflows for the last 30 days, it indicates that accumulation has become quite significant.


