

The Cardano price fell 1.3% during Tuesday’s U.S. market session to trade at $0.77. The selling pressure aligns with the broader market pullback as the majority of major digital currencies try to recover the exhausted bullish momentum. While the declining trend in ADA’s open interest reinforces the prolonged correction, the potential formation of a flag pattern hints at an imminent breakout.
Speculative Activity Cools as Cardano Price Drops Below $0.80
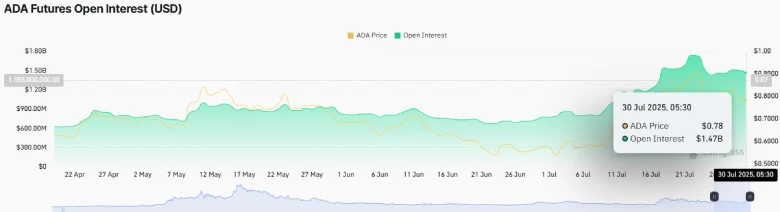
Over the past week, the Cardano price has shown a brief correction from $0.937 to a current trading value of $0.78, registering a loss of 16.7%. This reversal aligns with a broader market pullback as the market sentiment enters a post-rally correction to recuperate the exhausted bullish momentum.
Following the price, the ADA futures open interest dived from $1.74 billion to $1.47 billion, registering a 15.5% loss. This decline implies a significant unwinding of leveraged positions and a cooldown in speculative activity.
Such declines often reflect reduced traders’ confidence in the short-term trend of an asset, signaling the continuation of the current correction. Such shifts in derivatives activity often influence future price trajectories, which we’ve covered in our Cardano price forecast.
Flag Pattern Hints at Imminent Breakout For ADA
In the first three weeks of July, the Cardano price showed a parabolic rally from $0.536 to a recent high of $0.937, accounting for a 17.67% drop.
The regulatory development in the US was among the primary reasons for this surge; however, the coin price entered a brief correction in the last week of the month. Interestingly, the price correction resonated strictly within two converging trendlines, signaling the formation of a bull-flag pattern.
The chart setup commonly occurs in the middle of an established uptrend, as it offers the required break for buyers to recuperate from the exhausted bullish movement. However, with the intraday loss of over 1.31%, the price could continue its current correction for another 6.5% and test the pattern’s bottom trendline at $0.729.
If the support holds, the Cardano price could rebound for a bullish breakout from the pattern’s resistance trendline, signaling the continuation of the prevailing recovery. The post-breakout rally could push the price 21% up to re-challenge the last upswing high of $0.9373.

However, if the sellers continue to defend the $0.937 barrier, the current correction could extend into a sideways trend until buyers gain sufficient momentum for a leg up.
