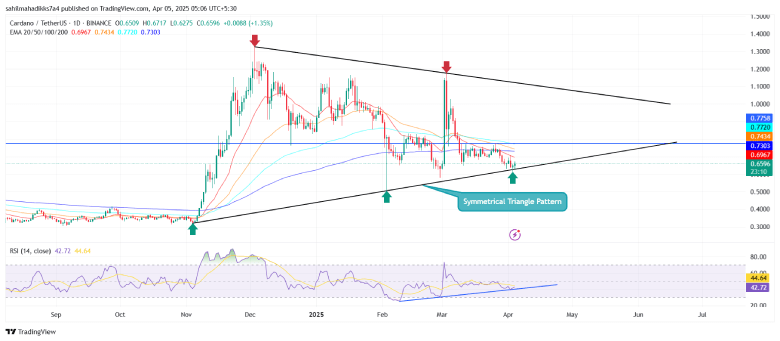
Defying the accelerating selling in the U.S. stock market on Friday, the digital assets show notable resilience and low volatility. With Bitcoin holding its position above $80,000, most major altcoins, including ADA, seek bottom support to recuperate the bottom support. An analysis Cardano price chart a potential formation of a symmetrical triangle pattern that could guide the buyers for the next recovery leap
Key Highlights:
- The formation of a symmetrical triangle pattern drives the current consolidation in Cardano price.
- The $0.77 level, coinciding with the 200-day EMA, creates a significant resistance zone against buyers.
- A bullish reversal in RSI shows increasing buying pressure at the bottom support trendline.
Cardano Price Eyes Major Reversal Amid Triangle Pattern
The first of April was filled with uncertainty for crypto investors as an attempt for recovery was suddenly hindered by panic over the global tariff war. Following the U.S. government’s new tariff on all imports from various countries, the broader market has witnessed a surge in selling.
Thus, the Cardano price dived to a monthly low of $0.613 this Thursday, seeking support from the lower boundary of the symmetrical triangle pattern. Theoretically, the pattern offers two converging trendlines as dynamic resistance and support before the price builds enough momentum to break either.
Since November 2024, the dynamic has acted as a major accumulation zone for investors, with the last reversal driving a 132% surge.

In the last two days, the ADA price has bounded 8% from the lower support to currently trade at $0.66. If the pattern holds true, the new upswing should surge 58% and challenge the key resistance at $1.
On the contrary, a breakdown below a lower trendline will invalidate the bullish trend and intensify selling pressure.
Technical Indicators:
Relative Strength Index: Concerning the Cardano price retest to a lower trendline, the momentum indicator RSI shows a series of higher-lower formations, indicating increasing buying pressure.
Exponential Moving Average: The cluster of daily EMA (20, 50, 100, and 200) positioned between the $0.7 and $0.78 range creates a strong resistance zone.
Also Read: Solana Forms Bullish Setup Amid S-1 Filing for Grayscale SOL ETF—Is $150 Close?


