BNB, the native cryptocurrency of the Binance exchange, was up 1.58% during Thursday’s trading session to $591. The buying pressure followed Bitcoin’s continued attempt to regain the $85,000 level and the easing panic surrounding the U.S.’s reciprocal tariff.
In addition, the Binance coin price analysis reveals the formation of a bullish reversal pattern, signaling the buyer’s opportunity to hit the $700 target.
BNB Price Rebounds from Dynamic Support Zone
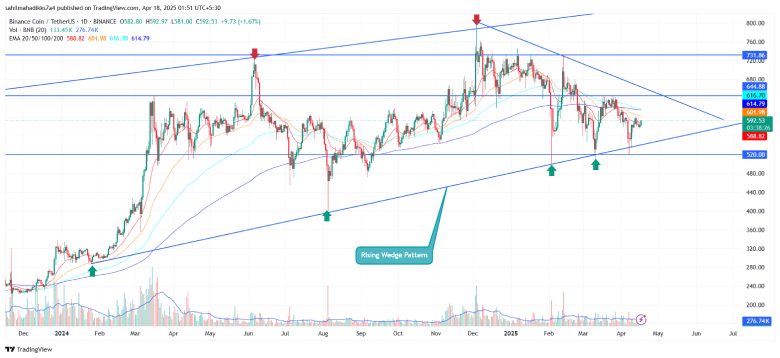
Amid the tariff-driven rally, the BNB coin price dropped 16% in the first week of April to a low of $5.20. However, the price rebounded immediately after U.S. President Donald Trump announced a 90-day suspension on its reciprocal tariffs.
Interestingly, the rebound occurred at an ascending trendline that has supported the Binance coin price since January 2024. The dynamic support stands as a high-accumulation zone for buyers, as previous reversals resulted in a rally ranging from 50% to 124%.

According to CoinGecko data, the BNB price currently trades at $589.00 and maintains its market cap at $83.09 billion.
Double-Bottom Pattern Signals 8% Surge Before Major Breakout
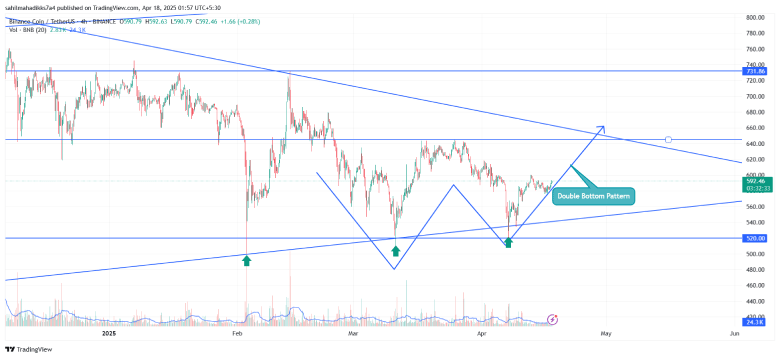
In the 4-hour chart, the recent upswing reveals the formation of a well-known bullish reversal pattern called the Double Bottom. This chart pattern is characterized by two distinct troughs forming at approximately the same price level, separated by a moderate peak in between.
‘W’ shaped, this pattern signals a shift in market sentiment from selling to buying, as the asset tests a key support level twice and fails to break lower. Typically, a breakout above the intermediate peak (also called the neckline) confirms the pattern and drives a sustained recovery trend.

If the theory holds, the coin price could surge another 8.8% to reclaim daily Exponential Moving Averages (20, 50, 100, and 200) and breach the $645 neckline. The post-breakout rally could push the asset to $770.
Also Read: Helium Network’s Rapid Expansion Sets Stage for HNT Price Crossing $5


