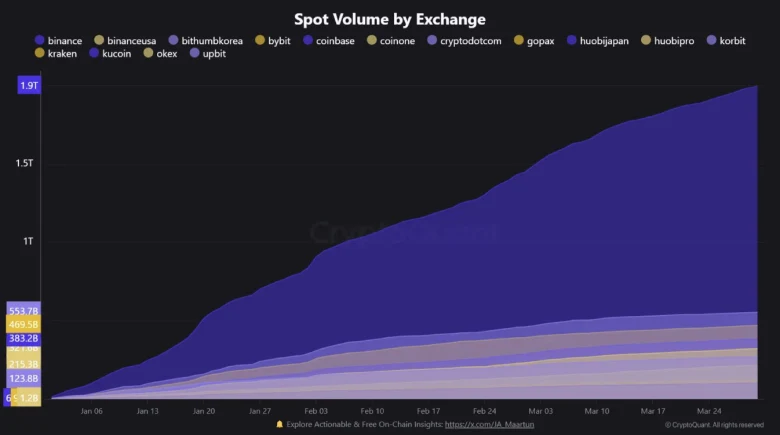
The crypto market kickstarted April on a bullish note as Bitcoin teased another breakout from $85,000. While this uptick isn’t sufficient to change market dynamics, certain altcoins like BNB continue to demonstrate dominance in their field. The recent data on spot market volume highlights Binance’s performance among other exchanges, reinforcing its potential for higher rally.
Key Highlights:
- Binance controls 43.66% of the total spot market, with $1.9 trillion in volume
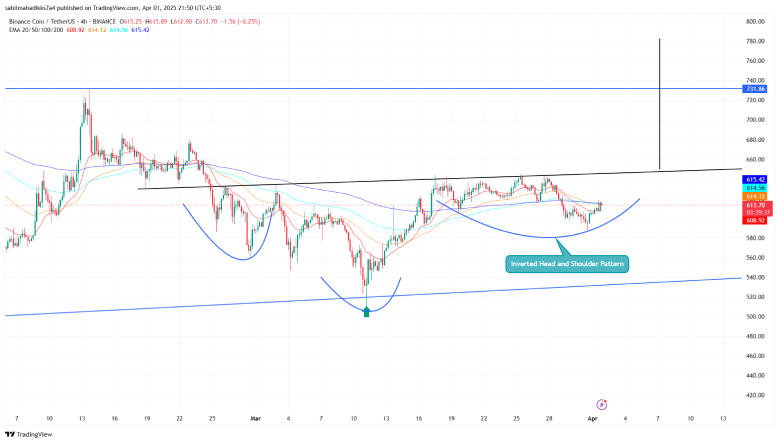
- A potential breakout from the inverted head and shoulder pattern sets BNB price for a +20% surge.
- The $620 to $648 stand as a troublesome resistance zone for crypto buyers as daily Exponential Moving Averages (20, 50, 100, and 200) could offer additional resistance.
Binance’s Spot Trading Dominance Fuels BNB Growth
Amid the recent market uptick, the BNB price showed a bullish bounce from $587 to $616 current trading value, registering a +5%. As the price trajectory gains momentum, the Binance exchange records its continued dominance as it commands a staggering 43.66% share of the total spot market.
The exchange has recorded over $1.9 trillion in cumulative spot volume since the beginning of the year.

CryptoQuant’s analysis reveals that Binance’s share, out of the total $4.56 trillion spot trading volume, is more than 3.6 times greater than its nearest rival. Moreover, its activity surpasses the combined volume of the next five largest exchanges, cementing its status as the industry’s central trading hub.
Binance growth curve will positively boost the usage of its native cryptocurrency BNB, driving its price higher.
Inverted Head and Shoulder Pattern Set +20% Rally Ahead
Since mid-March, the BNB price has consolidated in a narrow range from $643 to $593 level, projecting an uncertain market sentiment. While these short-bodied candles indicate no clear initiation from buyers or sellers, a look at the 4-hour time frame chart highlights the formation of an inverted head and shoulder.
This pattern consists of three troughs, with the middle trough (head) flanked by two shallower pullbacks (shoulders). If the chart setup holds true, the BNB price is poised for a bullish breakout from neckline resistance at $645.
The potential upsurge will reclaim key daily EMAs (20, 50, 100, and 200) reinforcing the idea of a renewed recovery trend. Thus, the coin price could chase a 21% surge in the coming weeks and hit the $784 level.

On the contrary, if sellers continue to counterattack at the neckline resistance the BNB price could make another dive to $550 support.
Also Read: Bybit Shuts Down NFT, Inscription & IDO Platform Amid Market Downturn


