


Binance coin (BNB), the native cryptocurrency of the BNB Chain ecosystem, witnessed a sudden reversal from its new all-time high of $809.31 during Wednesday’s market session. The coin plunged over 3% to currently trade at $763 in the market, signaling a potential bearish breakdown from a well-known chart pattern. Despite the broader market correction, the derivative market shows confidence in buyers’ conviction for a continued recovery.
BNB Rally Gains Derivatives Backing with 57% OI Jump
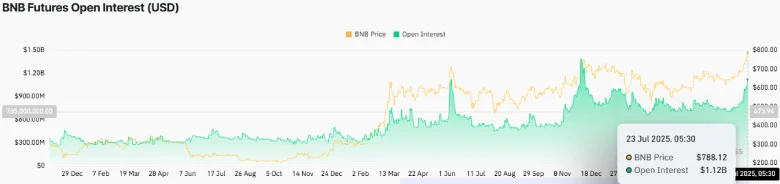
Over the past week, the BNB price showcased a high momentum rally from $675.30 to a new all-time high of $809.85. The sharp recovery raised the traders’ speculation for continued recovery as reflected by the increasing futures open interest in the derivative market.
According to Coinglass data, the open interest (OI) for BNB futures has surged from $710 million to $1.12 billion, marking a significant increase of 57% over the past three weeks. The surge indicates strong capital inflow into the derivatives market, with new open positions and traders anticipating a strong move ahead. However, this indicator does not reflect the direction of this move.
Therefore, potential market participants can look for the BNB OI-weighted funding rate, which recently reached a peak of 0.025%. Despite the recent price pullback, the metric remains in a positive region, indicating that buyers are confident in paying a premium to hold their long positions.

Binance Coin Drives Recovery Within Channel Pattern
The intraday chart of BNB coin shows a sharp price reversal from the recent high of $819.85 to the current trading price of $767.9, accounting for a 5% loss. This pullback likely followed broader market momentum as a majority of major cryptocurrencies entered a post-rally correction state.
However, the Binance coin currently witnesses a firm demand pressure at the support trendline of a rising channel pattern at $752. This trendline forms the lower boundary of a rising channel pattern on the 4-hour chart, which is currently guiding a steady uptrend in the asset.
If the support holds and shows a reversal candle structure at the bottom trendline, the coin price could bounce 5% to challenge the new high for a bullish breakout.

On the contrary, if the sellers breach the channel support with the 4-hour candle closing, the coin price may enter a sustained correction trend.
Also Read: South Korea Pushes Back on Crypto ETF Risk Amid Market Concerns
