Since last weekend, the Bitcoin price has experienced heightened volatility, exhibiting wide swings on the daily chart. The fluctuation can be attributed to the recent sale of 80,000 BTC by a whale who had bought them 14 years ago. However, the coin price shows strong resilience in the face of this sell-off and has regained its previous position above $18,000. Will this recovery sustain, or will the price be forced to enter a deeper correction?
Galaxy Digital Executes $9B BTC Sale
Last Friday, the Bitcoin price witnessed a sudden drop to $114,518, following a massive sale of BTC. Galaxy Digital, a global leader in digital assets and data center infrastructure, recently executed this sale of more than 80,000 bitcoin (worth over $9 billion) for a Satoshi-era investor.
However, Ki Young Ju, the founder and CEO of Crypto Quant, highlights that this massive transfer likely originates from wallets originally hosted by MyBitcoin.
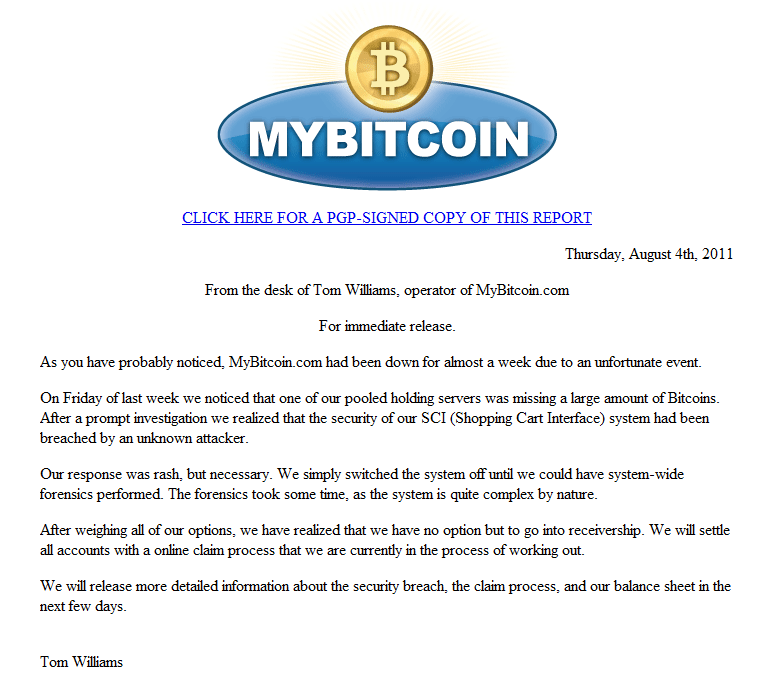
Founded in 2011, MyBitcoin was among the early custodial wallet services before meeting a chaotic end. In July, MyBitcoin faced a hack that resulted in the loss of approximately 78,747 BTC—the number is quite close to the recent $80,000 transfer.
Thus, the aforementioned Satoshi-era investor could belong to the hacker or the anonymous founder of MyBitcoin, Tom Williams.
“It seems Galaxy Digital bought the #Bitcoin from them, but I’m not sure if they did any forensics.” Ki Young Ju added in his tweet.
However, the Bitcoin price immediately regained its lost ground by Sunday, indicating its resilience to such massive whale movement in the market.
Flag Pattern Set BTC Price for New High
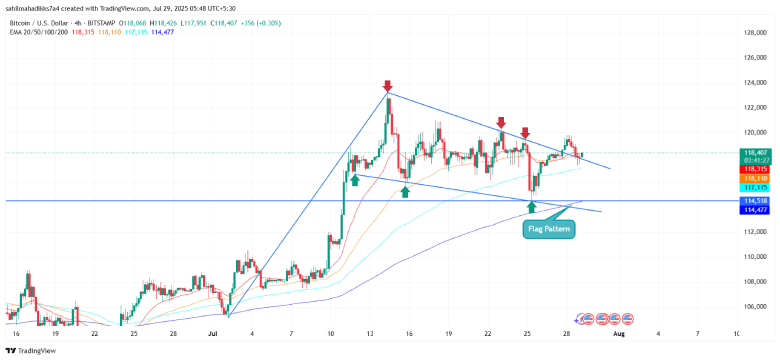
Since last weekend, the Bitcoin price has witnessed a brief correction from $123,236 to a low of $114,518, registering a 7% drop. However, the pullback resonated within two downstream canine neurons, indicating the formation of a bullish continuation pattern called a flag.
The chart setup is commonly spotted in the middle of an established uptrend as it offers buyers to replenish the exhausted bullish momentum. On Sunday, the BTC price gave a bullish breakout from the pattern’s resistance trendline, signaling the continuation of the prevailing recovery.
However, the intraday sell-off of 1.2% today shows a bullish retest of the breached trendline.
The long-tail rejection candles accentuate the intact demand pressure after the breakout. With sustained buying, the breakout rally could hit $124,670, followed by an extended leap to $130,000.

On the contrary, if the retest candle falls within the flag structure, the sellers could strengthen their grip over this asset to drive an extended correction.


