

- On-chain data highlight a notable decline in BTC holdings from whale-controlled wallets, signaling a risk of prolonged correction.
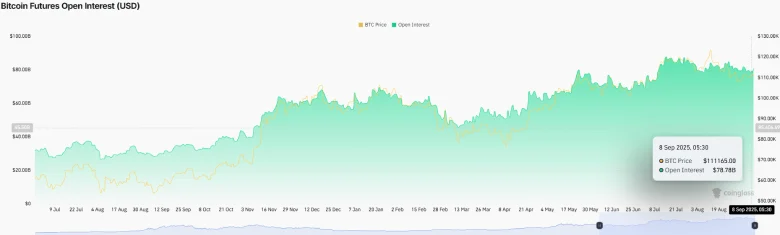
- BTC’s future open interest dropped 10% over the past three weeks, indicating a risk-averse sentiment among derivative participants.
- Bitcoin price aims for a bullish breakout from the neckline resistance of the inverted head and shoulder pattern to renew recovery momentum.
On Monday, September 8th, the Bitcoin price jumped over nearly 1% to reach a trading value of $111,500. The buying pressure came as a relief rally, which analysts believe could recoup the exhausted bearish momentum before the next downturn. The on-chain data further highlights that BTC whale holdings dropped sharply after months of steady accumulation, signaling a risk of a bigger distribution phase. Do bulls have an opportunity to counterattack?
Bitcoin Correction Deepens With Lower Leverage and Whale Distribution
Over the past four weeks, the Bitcoin price has shown a brief correction from $124,517 to the current trading value of $111,463, representing a 10.62% loss. This comes just after Bitcoin price dipped below $112K, fueling talk of a potential $100K revisit. A notable contributor to this downtrend is uncertainty surrounding the U.S. Federal Reserve’s monetary policy for the September rate cut.
Along with falling prices, BTC futures open interest fell from $87.89 billion to $78.8 billion, registering a 10% decline as well. The falling OI price indicates that derivatives traders are exiting the market due to liquidation or reducing their position to manage risk in the current uncertainty.
The drop in speculative traders could slow down recovery momentum in price or drive a prolonged consolidation trend.
In addition, on-chain monitoring tools have shown that whale-controlled Bitcoin wallets are recording a significant drop in holdings after a few months of steady accumulation. The aggregate balance of large addresses has declined below 3.36 million BTC, ending a trend of consistent inflows that started in the early part of the year.
This change is apparent in the 30-day percentage change measure, which has shifted drastically to the negative. This implies that significant amounts of coins have moved out of long-term concentrations into wider circulation. These types of accumulation-distribution phase transitions, historically, have been accompanied by amplified price fluctuation as liquidity dynamics shift across the economy.
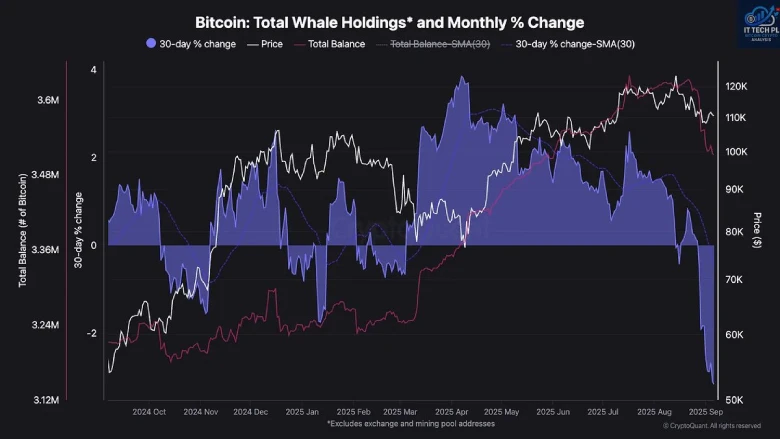
The shrink in whale balances coincides with a period when the price of Bitcoin has been sensitive to supply movement.
Also Read: BRETT Coin Price Bounces Back: Will It Break Through $0.1?
Bitcoin Price Nearing Bullish Breakout From Inverted H&S Pattern
In the last two weeks, the Bitcoin price correction has shifted its trajectory to sideways, holding above the $107,500 support. However, a deeper analysis of this consolidation shows the formation of an inverted head and shoulder pattern.
The chart setup is characterized by three troughs, including a middle head and two shallow dips as shoulders. Historically, the pattern is spotted at major market bottoms, supporting a renewed buying pressure and bullish recovery.
Currently, the BTC price is just 2% short of challenging the pattern’s neckline resistance at $113,284. A potential breakout would accelerate the buying pressure and bolster buyers to challenge the immediate resistance at $117,300 before aiming for a new high above $125,000.
In the 4-hour chart, the flattish trend in the 100 and 200 exponential moving averages accentuates a neutral market sentiment. The momentum indicator, RSI (Relative Strength Index), at 50% further accentuates neutral bias among market participants.

If the sellers continue to defend the resistance at $113,400, the BTC price could drive another downtrend toward the $107,500 support. A potential breakdown will intensify the bearish momentum for a prolonged correction towards $103,143, followed by $98,240.

