


Key Highlights:
- BTC’s new investor dominance wavering at the 30% mark signals the coin price is far from the market top.
- No major signals of panic selling or capitulation from older coins indicate a stable bull trend in action.
- The formation of a bull flag pattern sets the next breakout in the Bitcoin price.
- The coin price could seek stable pullback support at the 50-, 100-, and 200-day EMAs.
On Thursday, July 31st, the Bitcoin price continues to project low volatility trading as it struggles to sustain above the $120,000 barrier. The daily chart highlights a series of neutral candles with long wicks, indicating a lack of conviction from buyers or sellers to lead a sustained direction. While this uncertainty raises correction risk, the on-chain data highlights that new investors are steadily flowing into BTC as the market is still stable in the late bull cycle phase.
BTC New Investor Influx Grows, But Not Overheated Yet
Over the past three weeks, the Bitcoin price has been grappling with the $120,000 resistance and shifted its recovery trajectory to sideways. A series of short-body candles with long rejection wicks on either side resembled a distribution phase and risk for potential correction ahead.
Despite the mounting selling pressure, the recent on-chain data reveal that the BTC price is navigating through a stable late-stage bull cycle amid the growing participation from new investors.
According to recent analysis from AxelAdlerJr, the Bitcoin market signaled a local top during March and December 2024 when the new investor dominance surged to a high of 64% and 72%, respectively.
Currently, the value wavers around 30%, indicating the bullish momentum without overheating. The purple fill (cumulative activity of young coins) has been steadily growing since July 2025, which highlights a layer of new buyers entering the market.
Furthermore, a coefficient of 0.3 highlights that the supply of three-year-old coins is still absorbing young demand. This moderate profit-taking by long-term holders suggests no signs of panic selling or capitulation.
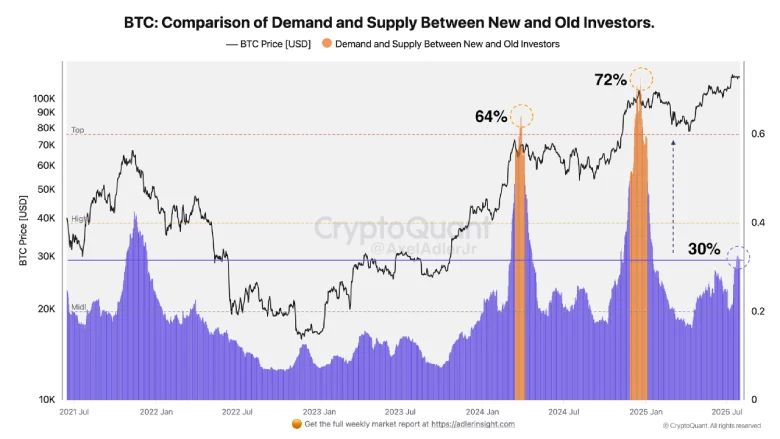
However, if the new investor’s dominance accelerates and hits the historical corridor of 0.6-0.7, profit-taking could intensify and bolster a potential market correction. As of now, the structure remains stable, and the bull cycle is maturing healthily.
Bitcoin Price Consolidation Reveals Flag Formation
The daily chart analysis of Bitcoin price shows the current consolidation is resonating within two down-sloping trends of a flag pattern. Historically, the pattern has commonly emerged within an established uptrend to recoup the bullish momentum for a higher rally.
However, a deeper analysis of the technical chart shows the coin price has developed an even narrower range between the horizontal levels of $120,300 to $117,000. Since mid-July, the coin price has failed to offer a daily candle-closing beyond the two horizontal levels, indicating a lack of uncertainty among buyers and sellers.
With an intraday loss of 0.76%, the coin price teases a bearish breakdown below the $117,000 support to drive a prolonged correction. If the candle closes, the price could plunge over 3.5% and test the flag support trendline at $112,556.
Until the chart pattern is intact, the coin price could prolong its current correction period.

However, the BTC price is positioned above the 50, 100, and 200 exponential moving averages, which indicates the broader market sentiment is still bullish. A potential breakout from the pattern’s overhead trendline will intensify the market buying pressure and boost the BTC price to $125,000, followed by an extended leap towards $130,000.
Also Read: Insider Blamed for $44M CoinDCX Theft: Malware Planted on Company Laptop
