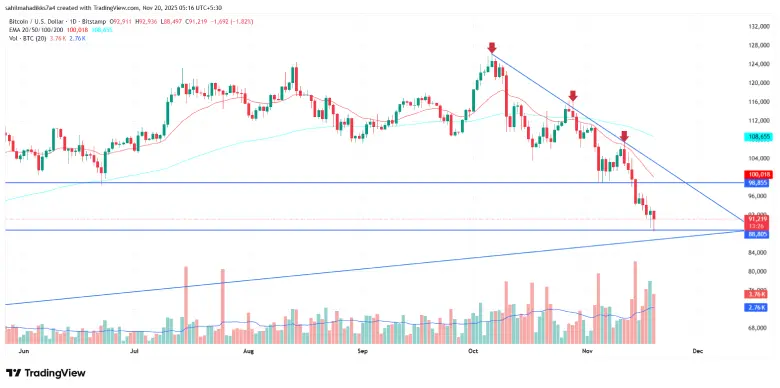
- The Bitcoin price is just 3% short of retesting a long-coming support trendline that drives long-term recovery in this asset.
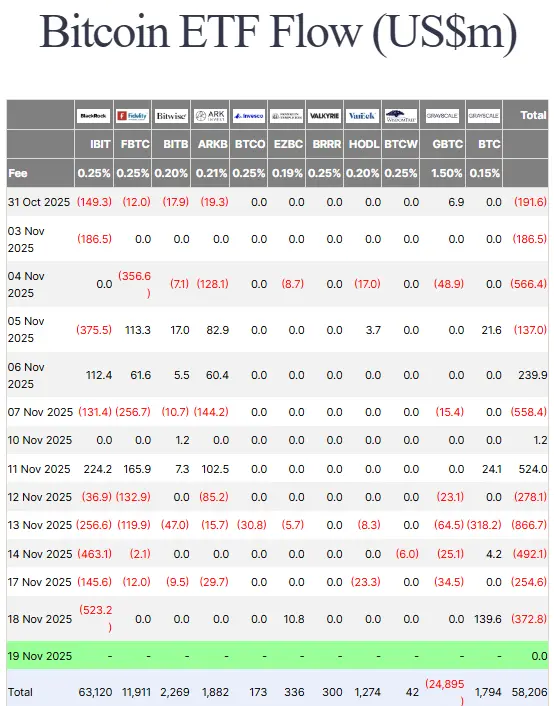
- IBIT recorded its worst single-day outflows on Tuesday, dropping nearly half a billion dollars.
- The falling 20-day EMA slope acts as dynamic resistance against buyers.
On Wednesday, November 19th, the crypto market was hit by another wave of selling pressure, which pushed the Bitcoin price to an intraday low of $88,497. The bearish momentum spread across the majority of major cryptocurrency signals the continuation of the prevailing market correction. The recent correction trend can be attributed to macroeconomic jitters in the U.S, as the Bureau of Labor Statistics (BLS) will not release the October jobs report, and delay the November jobs data to mid-December, heightening uncertainty around interest rate decisions.
Bitcoin Slides as Macro Blind Spot and ETF Outflows Shake Markets
Over the past weeks, the Bitcoin price has shown a high-momentum correction from $107,465 to $90,565, registering a 15.7%. Consequently, the asset market cap plunged to $1.8 trillion.
The selling pressure gained momentum as the BLS decided not to release the October jobs data, while also delaying the November data to December 16. The recent 43-day government shutdown has halted the key household survey collection, leaving a significant gap in unemployment and labor-force statistics.
Therefore, the agency is nearing its December policy meeting blind on two months of jobs data. With macroeconomic uncertainty, the market has been aggressively pricing in a December rate cut as odds fell from 97% to 33.6% according to the FedWatch tool. A strict or an alleviated monetary policy has often triggered a sharp liquidity withdrawal from risk assets, including cryptocurrencies.
In addition, the U.S.-based spot Bitcoin ETFs have witnessed a significant outflow since last week. Just the BlackRock’s iShares Bitcoin Trust (IBIT) endured its grimmiest day yet on November 19, 2025, recording $553 million in outflows as Bitcoin price teases a breakdown below the $90,000.
The ugly skid caps a five-day bleed exceeding $1.4 billion for the funds, according to the Farside investors’ data.
However, the Bloomberg analyst Eric Balchunas highlights a silver lining for IBIT as its year-to-date inflow still dazzles at +25 billion, underscoring a broader trend of institutional interest.
Thus, the combination of BLS data void, December rate cut jitter, ETF outlaws, along with long-term holders and technical breakdown is pressurizing the Bitcoin price for a prolonged correction.
Bitcoin Price to Extend Correction Within Channel Pattern
With an intraday loss of 2.8%, the Bitcoin price currently trades at $93,119. This downswing, backed by above-average trading volume, signals a firm conviction from sellers to extend the current downtrend.
With sustained selling, the BTC price could climb another 3% and test a long-awaited ascending trendline at the $88,000 mark. Since October 2020, the dynamic support trendline has bolstered buyers with a firm accumulation zone to recuperate the exhausted bullish momentum.
The resulting recovery has pushed BTC for a multiple-month recovery, signaling a key pivot moment for the mid-term trend. The declining trend in exponential moving averages (20, 50, 100, and 200), bolsters the bearish narrative as they offer dynamic resistance to price.
That said, the Average Directional Index (ADX) slope has surged to 38%, indicating that sellers are nearing the exhausted level in the current correction.

As a result, the Bitcoin price is projected to shift sideways above the $88,000 mark as it stabilizes above the long-awaited support trendline before the next major move.
Also Read: SharpLink Sends 5,442 ETH to Galaxy OTC Amid Ethereum Price Correction


