The pioneer cryptocurrency Bitcoin witnessed a downtick of 1.2% during Thursday’s trading session to reach an $81,831 floor. The market selling pressure accelerated after United States President Donald Trump announced new tariffs on a range of countries on April 2nd. While the market uncertainty persists, a recent death cross on the Bitcoin on-chain chart threatens a risk of extended correction.
Key Highlights:
- Bitcoin’s 30-day volume-weighted price below the 180-day slope indicates weakening momentum.
- On Thursday, April 3rd, the Bitcoin Fear and Greed Index plunged to 25%, indicating an extreme fear among market participants.
- A bearish reversal within the wedge pattern signals a +10% fall ahead.
BTC’s Onchain Death Cross Signals Extended Correction
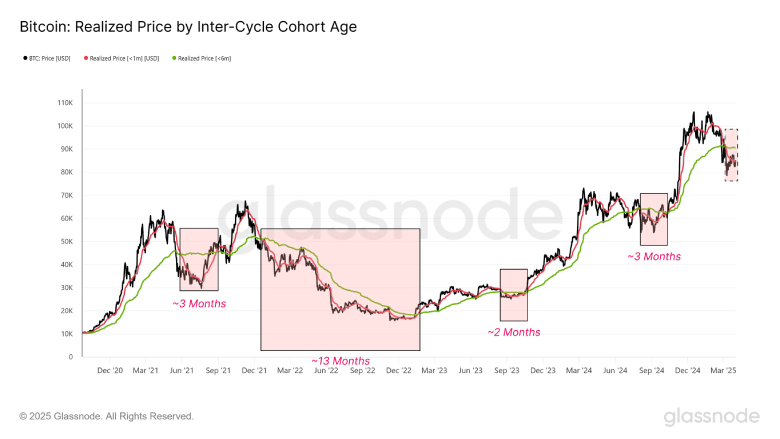
The first week of April has taken a bearish turnaround after Donald Trump imposed a 10% baseline tariff on all imports and higher duties for several countries. Amid the market downturn, Bitcoin’s realized price by Inter-Cycle Cohort Age” highlights another threat for coin holders.
This metric categorizes Bitcoin into different groups based on how long it has been since the coins last changed hands.
According to Glassnode data, the 30-day volume-weighted price of BTC has fallen below its 180-day counterpart, highlighting a notable weakening of market momentum. As highlighted in the attached chart, the indicator has consistently preceded bearish market phases lasting anywhere between three to six months.

If history repeats, the current Bitcoin price correction is poised for another major breakdown.
Here’s Why Bitcoin Price Reversal Could Hit $70,000.
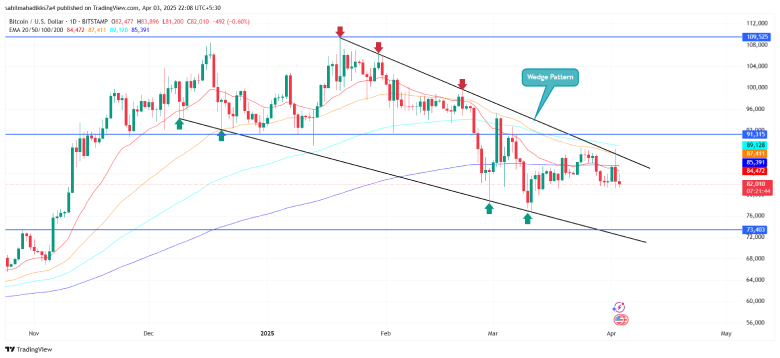
The Bitcoin price has plunged from $88,563 to $82,100 in the last 48 hours, accounting for a quick 7.3% fall. In the daily chart, the falling price marks a bearish reversal within the formation of a descending wedge pattern, as shown in the below chart.
Historically, a reversal below the resistance trendline has been preceded by a 16-21% fall before the BTC price could witness stable support at the lower trendline. As the coin price shows sustainability below the daily EMAs (20, 50, 100, and 200), the sellers could drive 13-14% before retesting the bottom support.

On the contrary, the falling wedge pattern has typically served as a temporary pullback for buyers to recuperate bullish momentum. Therefore, a potential breakout from the overhead resistance will improve the buyer’s grip on this asset to change the market dynamic.
Also Read: XRP Price Nears Major Breakdown as Trump’s Tariff News Triggers Sell-Off


