


The pioneer cryptocurrency, Bitcoin, witnessed highlighted volatility during Friday’s U.S. market hours. The daily candle highlights a notable sell-off during Asian market hours but a sharp reversal during U.S. trading hours. The resulting rejection candle accentuates the pressure demand pressure at the nearby support and bolsters the development of a bullish continuation pattern. Despite the initial sell-off, BTC open interest spiked to a new high on Bybit, signaling the growing speculation in the market for a dynamic move. Is a new Bitcoin high on the horizon??
Bitcoin’s Open Interest Soars on Bybit as Price
In the past two weeks, Bitcoin showcased a notable pullback from $123,236 to the current trading price of $117,199, projecting a 7% loss. The reversal is likely a post-rally pullback to recuperate the exhausted bullishness and profit-booking from short-term investors.
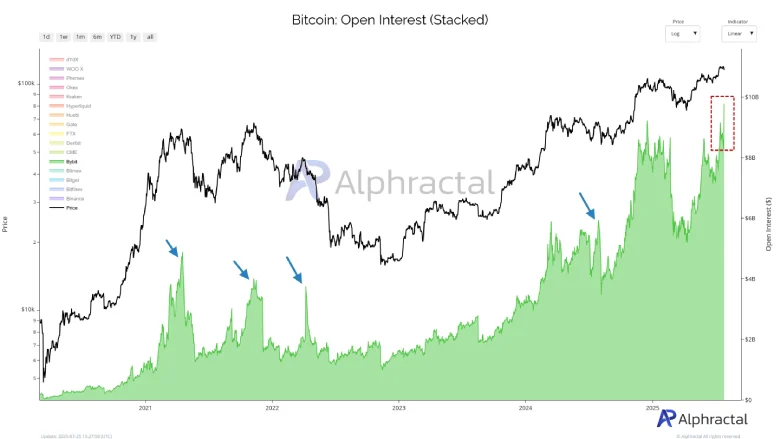
However, the derivative market data showed a continued recovery in Bitcoin’s open interest (OI) despite the price decline. The anomaly is being largely driven by derivatives activity on the crypto exchange Bybit. According to the data tracked by Alpharctal, Bybit recorded a record high OI increase of $1.52 billion in the last 24 hours.
Typically, the open interest increase is coupled with price recovery, indicating a sustained recovery driven by increasing market demand. However, the deviation signals something unusual beneath the surface, Alphractal noted in its recent market analysis.
While this isn’t the first time that Bybit’s OI has surged during the bitcoin price fall, it may indicate heightened speculative trading or aggressive short positions building up.
Flag Pattern Formation Hints Major Breakout Ahead
The 4-hour chart analysis of Bitcoin shows the current correction resonating between two downsloping trendlines of a potential flag pattern.
The chart pattern is characterized by a long pole accentuating the dominating uptrend in the market, followed by a temporary pullback to recoup the exhausted bullish momentum. The chart setup is commonly spotted in the middle of an established uptrend, as a breakout from the pattern’s upper boundary signals the continuation of the bullish market.
The BTC price currently trades at $117,262 with an intraday loss of 0.98%. The long-wick rejection attached to daily change highlights the intact demand and potential for a bullish upswing.

Thus, the coin price could bounce 1.1% to re-challenge the overhead trendline at $118,537. A potential breakout from this resistance will accelerate the bullish momentum and push the BTC price to a new high of $125,800, followed by an extended leap to $140,000.
Also Read: Ethereum Whale Activity Signals Healthy Market Rally, Not a Pump
