


On Wednesday, July 30th, the Bitcoin price traded in a narrow range, driving a low volatility session in the crypto market. The daily chart highlights a neutral doji candle, which accentuates the indecision among buyers and sellers. Notably, the coin price wavers near the major resistance of a developing bull flag pattern, suggesting a dynamic move loading in the near future. The Net Realized Profit/Loss Value showcases a distribution phase in the market, which increases the risk of a prolonged correction.
BTC Absorbs 80K BTC Distribution Amid High Net Realized Profit/Loss
Last weekend, the Bitcoin price witnessed a sudden sell-off as Galaxy Digital Inc. announced a successful execution of 80k BTC (worth $9 billion) for a Satoshi-era whale. Following the transaction, the average Net Realized Profit/Loss (NRPL) briefly spiked to $3.2 billion before reverting to $1.4 billion. This metric reflects the total profit or loss investors have locked in an asset, serving as a key on-chain indicator for market sentiment or a potential reversal point.
As the market steadily absorbs the selling pressure, the BTC price shows resilience above the $117,000 mark. However, the market analyst Axel Adler Jr. cautions that the current NRPL value is still high, which could continue to the market distribution phase and exert overhead pressure for BTC.
As highlighted in the chart below, a significant spike in NRPL has historically coincided with highlighted and bearish reversals in the market.
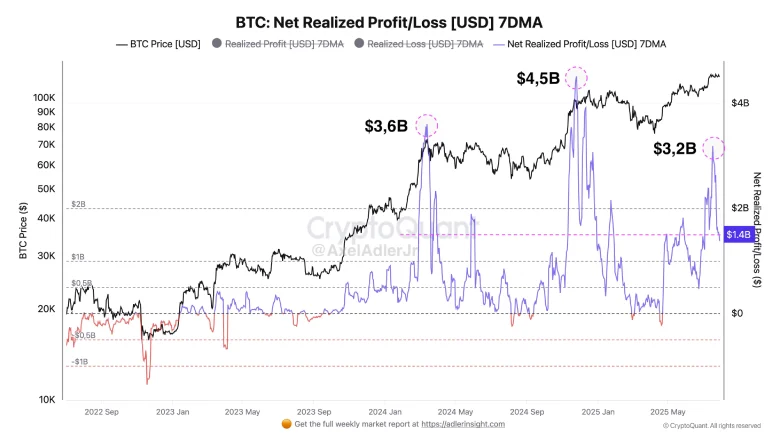
Axel further highlights that the bears currently have a slight advantage in the future market, which could force a correction towards $110,000.
Bitcoin Price at Pivot Spot Within Flag Formation
Since mid-July, the Bitcoin price recovery has shifted its trajectory sideways as buyers struggle to sustain above $120,000. Despite the recent volatility in the market, the Bitcoin price stayed within two downsloping trendlines, indicating the formation of a bullish continuation pattern called a ‘flag.’
If the pattern holds true, the BTC price is likely to recover its bullish momentum for the next breakout. A deeper analysis of the daily chart shows the price remained steady above the $116,870 level, which currently coincides with the 50-day exponential moving average.
A bearish breakdown below this support could accelerate the selling pressure in the market and push the coin price 3.4% down to test the flag support at $113,000.

On the contrary note, an upside breakout from the overhead trendline will signal the continuation of the bullish pattern and may chase $125,000.
