- Gold nears 38-year resistance as Bitcoin eyes breakout if momentum shifts.
- Any weakness in gold may trigger fast capital rotation into Bitcoin.
- Bitcoin could retest the $105K support if selling pressure persists.
In mid-October, Gold soared over $4,000 per ounce, pushing the metal to a new all-time high $4,342.This strong upward move, however, witnessed a pullback, drawing attention from investors across the investment landscape.
Meanwhile, Bitcoin had a flash crash, which temporarily dropped the price to just $101,000 before recovering. Now, as gold slows, attention is turning toward Bitcoin’s potential for a breakout.
Bitcoin Awaits Momentum Shift as Gold Hits Multi-Decade Resistance
Gold is now closing in on a massive resistance level that dates back nearly four decades, according to a recent analysis by Market Expert Mister Crypto on X. This long-term trendline has rejected multiple price surges. While the current rally has brought gold near that level, it hasn’t yet made a decisive breakout.
The analyst emphasized this moment, noting that “any sign of weakness here” could spark movement. He added that if gold fails to push through resistance, money may rotate swiftly into Bitcoin.
Gold is about to touch this MASSIVE resistance level.
Any sign of weakness here and money will rotate into Bitcoin.
Digital Gold will win. pic.twitter.com/6YO1ZZmj3V
— Mister Crypto (@misterrcrypto) October 30, 2025
This dynamic corresponds to a familiar lead-lag correlation between the two value assets. During periods of uncertainty, capital is drawn into gold and into hedging against inflation. However, when gold falters on critical levels, Bitcoin has in the past come in as the new capital magnet. With gold stalling and Bitcoin stabilizing, some investors believe the setup may repeat.
Furthermore, market commentator KomodoCrypto reiterated on Crypto Mister’s post, noting that the current gold zone is at a “massive resistance and all eyes are on what happens next.”
In previous cycles, BTC has outperformed following gold stagnation at major resistance zones. These periods have seen traders and institutions frequently rotating into digital assets to get better upside. That history, along with the current price action, implies a possible inflection point approaching. In the event of gold stalling, Bitcoin (BTC) may experience intense buying power within a short period.
With charts showing gold just shy of its long-standing ceiling, the market is on high alert. KomodoCrypto further added that, “History rhymes, every time gold hesitates, BTC steals the spotlight.”
Fed Rate Cuts and Market Momentum May Shift Capital Toward Bitcoin
The Federal Reserve recently lowered interest rates by 25 basis points. At the same time, it confirmed that quantitative tightening will end on December 1. The moves have created substantial momentum in key stock exchanges, such as the Nasdaq and S/P. Both have scored new all-time highs, and this is an indication of fresh cravings towards risk-on assets.
“Once the market realizes the four year cycle is not going to driving the market in the future …. We Will quickly go to 200k” (bitcoin price) pic.twitter.com/kKv13rx3ta
— ClipsNotMagz🍟 (@ClipsNotMagz) October 30, 2025
As equities approach record levels, the investor might soon seek out assets that have more potential. Bitcoin continues to be a candidate for capital rotation as risk sentiment enhances. Further liquidity and optimistic factors may lead to interest in the cryptocurrency market in the weeks ahead.
Bitcoin Price Target $105,000 if the Current Trend Holds
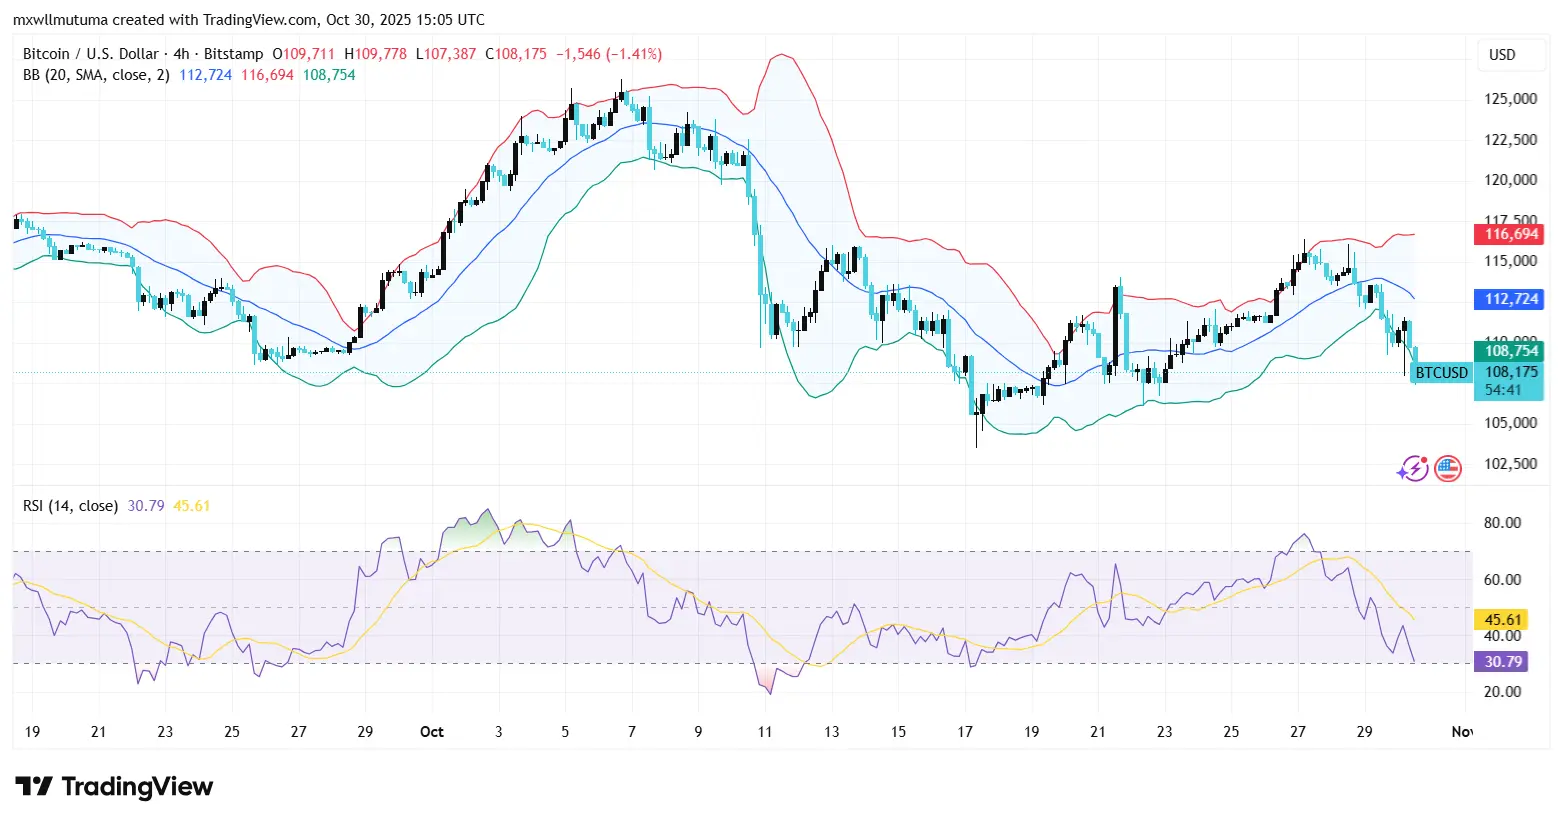
BTC is trading in the red today, showcasing the weakness in the entire cryptocurrency market. Bitcoin was trading at $107,817 as of this writing, a decline of 4% over the last 24 hours. Despite the price demonstrating a weak performance, trading volume has increased by 20% to reach $76 billion.
Technical indicators on the daily chart display a continuous decline since the start of the week. The price has formed a series of red candlesticks, leading to the formation of a descending channel pattern. The price has breached the support at the middle Bollinger Band at $110,718.

The lower Bollinger Band at $105,390 represents the next level of BTC support. BTC might retest this level in the coming sessions should the bears retain their tight grip on the ground.
Additionally, the RSI indicator has dropped below the neutral level, hovering around 42, indicating that the selling pressure is increasing. However, BTC could reverse this downtrend if buyers step in and push BTC to retrace the resistance at $105,390.


