- Bitcoin price extends its mid-term uptrend, resonating within the formation of rising channel patterns.
- According to Sosovalue data, the U.S.-based spot BTC ETFs witnessed a daily net outflow of -$57.78 million.
- BTC fear and greed index at 64% reflects a bullish market sentiment.
On Thursday, October 9th, the Bitcoin price witnessed a sudden drop of nearly 3% before reverting above $121,851. The initial selling pressure can be attributed to profit-taking from short-term holders and market uncertainty surrounding the extended shutdown of the U.S. government. Despite the mounting selling pressure, the pioneer cryptocurrency shows notable resilience above the $120,000 floor amid an aggressive inflow from the spot BTC ETFs.
BTC ETF Inflows Hit 9-Month High as Institutional Demand Roars Back
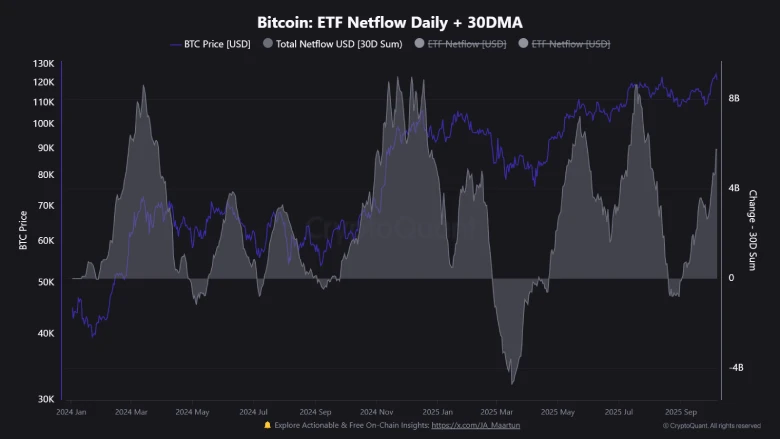
According to on-chain analytics platform CryptoQuant, spot Bitcoin ETFs have emerged as a significant driver behind Bitcoin’s current price action, with capital inflows ramping up considerably over the last month. The net inflow for all spot Bitcoin ETFs in 30 days amounted to a total net inflow of $5.76 billion, marking a return to institutional interest following a relatively inactive summer period.
On October 6, the sector saw a one-day inflow of $1.09 billion, the largest single-day increase since mid-February 2025. The surge took cumulative lifetime inflows for spot Bitcoin ETFs over $70 billion for the first time in the product category.

Trading data also indicates Coinbase, the main exchange counterpart for the U.S.-based ETF issuers, has soaked up much of this demand. The Coinbase Premium Index (which measures the difference in the price of Coinbase vs. exchanges worldwide) has routinely shot well above $100 and has been positive for 42 straight days, indicating the U.S. institutional accumulation continues unabated.
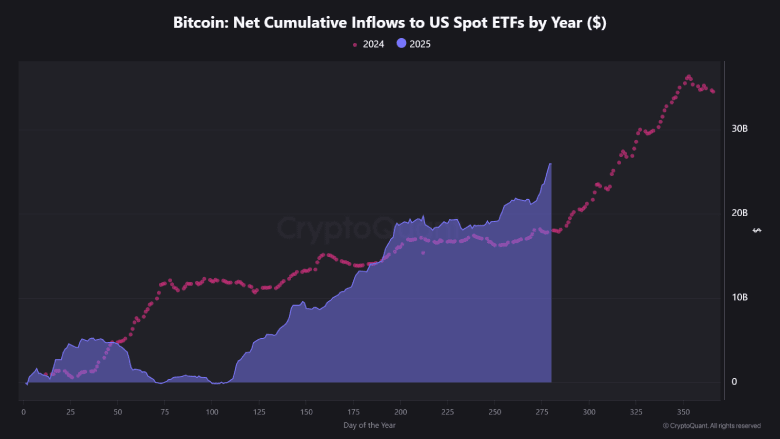
So far this year, ETF inflows are higher than the cumulative results in 2024. Capital added since January is up to about $25.94 billion, up from $17.8 billion in the same period last year. That difference of over $8 billion shows the magnitude of continued activity from asset managers and funds putting money into Bitcoin.
CryptoQuant estimates the average price that these ETF positions were bought for to be approximately $86,400 per Bitcoin (about 40 percent higher than the current spot price), suggesting long-term holders have not been deterred by near-term market volatility and are still convinced of the underlying value of the cryptocurrency.
CryptoQuant’s most recent data also confirms that the ETF-driven liquidity trend seems to be well-grounded in Bitcoin’s current market construction, bolstering the price for an environmentally friendly recovery.
Bitcoin Price Stalls At Major Resistance
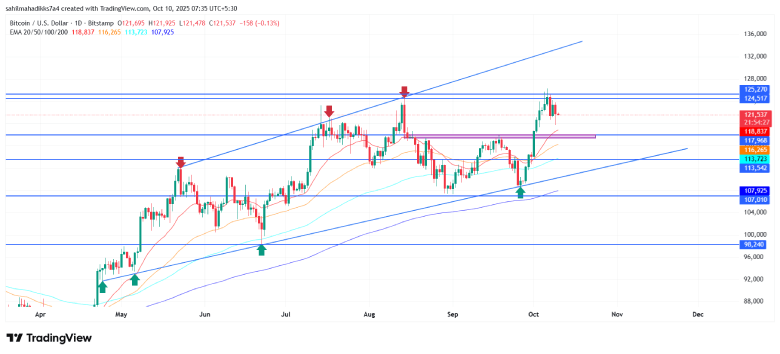
In the last two weeks, the Bitcoin price has showcased a notable recovery from $108,696 to $121,928, accounting for a 12.2% gain. However, the recovery momentum halted at the $125,000 psychological level as short-term investors rushed for profit after it made a new high of $126,272 on Monday.
The overhead supply pushed a sharp reversal of 2.5% the very next day, signaling a potential for a renewed corrective move. If the selling pressure strengthens, the price could break below $120,700 with a daily candle closing.
The post-breakdown fall could push the price another 6.5% to test the bottom trendline of a long-coming channel pattern at the $112,500 mark. Since late April 2025, the Bitcoin price has been actively resonating within the two ascending trendlines of the channel pattern. A recent history of this pattern shows that each retreat to the bottom trendline has often bolstered buyers with renewed bullish momentum to drive its next price leap.

The daily candle today shows a long wick rejection tail at the $120,000 mark, signaling an intact demand pressure from below. If the buyer continues to defend this floor, the Bitcoin price could drive a short-term consolidation before offering a decisive breakout from the $125k resistance. The potential breakout will accelerate the buyer’s strength to drive an extended rally to $130,000.
Also Read: Why SOL Price and Transaction Volume Dip Despite Solana ETF Hype?


