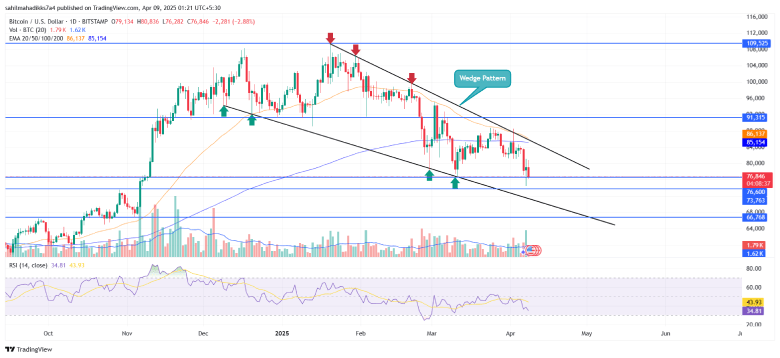
The crypto market correction continues to pace its momentum in April’s second week, along with Bitcoin falling below the $78,000 mark. The primary catalyst that bolsters the selling pressure is the imposition of a new tariff by the United States and the retaliatory tariff by other nations. While the falling BTC is poised for another support breakdown, the on-chain data highlights active accumulation from investors, leveraging the asset’s discounted price.
Key Highlights:
- Bitcoin price correction resonating within a wedge pattern formation signals a dive to $70,000 is next.
- $220 million worth of Bitcoin exiting centralized exchanges indicates buy-the-dip sentiment among investors.
- A potential death crossover between the 50-and-200-day exponential moving average could exert additional selling pressure on BTC
$220M BTC Outflow Signals Accumulation Amid Panic
The crypto market entered the second week of April with a massive sell-off, which pushed the Bitcoin price to a 5-month low of $74,434. Amid this fall, Bitcoin withdrawals from centralized exchanges spiked dramatically, resulting in net outflows exceeding $220 million, according to IntoTheBlock data.

The data suggests that these players were not exiting the market in panic but rather accumulating more BTC at discounted prices. If the strategic accumulation continues, the BTC price could seek suitable bottom support and prepare for a bullish turnaround.
Bitcoin Price Correction Signal Another Breakdown, But There’s Catch
On Tuesday, April 8th, the Bitcoin price plunged 2.68% to reach a trading value of $77,006. The selling pressure escalated as U.S. officials stated that a new round of tariffs on Chinese goods is set to take effect at 12:01 a.m. EST on April 9th, according to a Bloomberg report. This revised tariff is speculated to be as high as 104%.
Thus, the Bitcoin price will likely breach the five-month support of $77,600 and drive a 10% fall to wedge pattern support at $68,860. Since December 2024, the BTC correction has strictly resonated within the pattern of two converging trendlines, validating its strong influence in this pattern.

If the pattern holds true, the BTC price could rebound again around the $70,000-$68,860 region and drive a recovery to the overhead trendline. A potential breakout from this resistance will tease the asset from the downward trend.
Also Read: SUI Price Eyes Key Breakout as Canary Files for ETF with CBOE


