


The pioneer cryptocurrency, Bitcoin, witnessed highlighted volatility during Thursday’s U.S. market hours. The daily candle displayed a wide price spread, ranging from $117,201 to $119,525, with a long wick rejection and a neutral body, indicating a lack of conviction from both buyers and sellers. Despite the short-term uncertainty, the Bitcoin Net Unrealized Profit/Loss (NUPL) indicates that the BTC price is far from its peak.
NUPL Metric Signals Bitcoin Still Has Room to Grow
Since last month, the Bitcoin price has exhibited a high-momentum rally, rising from $98,240 to a new high of $123,236, registering a 25% growth. Since the new high, the coin price shifted its trajectory sideways, creating a market concern for a potential correction or a change in trend.
However, a recent tweet from CryptoCon offers crucial insight into Bitcoin’s current market position, specifically regarding its cyclic top in relation to the NUPL metric. According to the report, the Bitcoin price has yet to exceed its current cyclic top cross on NUPL. Typically, this metric indicates a tipping point in the market, where the difference between realized profits and unrealized profits becomes more pronounced, often signaling a shift in market sentiment.
In the previous cycle, the NUPL Fibonacci accurately timed the November 2021 cycle top and November 2022 cycle bottom.
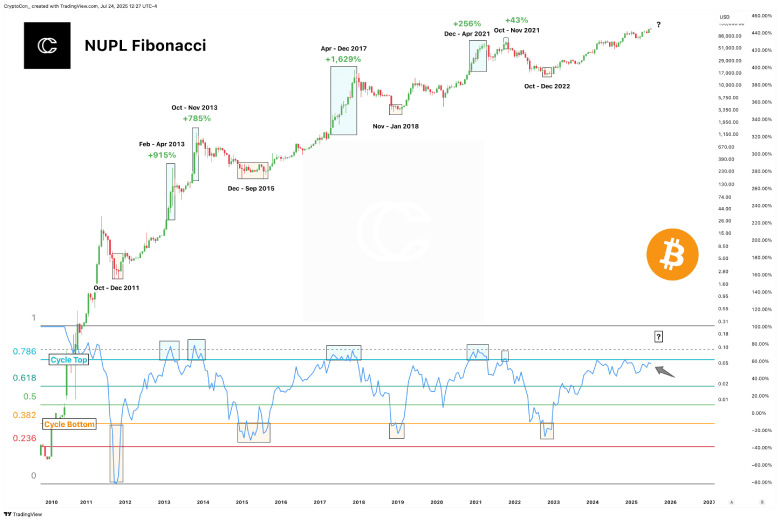
According to the shared report, the current BTC price is yet to surpass the 0.786 mark of the NUPL Fibonacci, indicating the current market is far from its peak, and BTC has more room to grow.
Bitcoin Price Coiling for Pennant Breakout
Since mid-July, the Bitcoin price has been wavering around the $118,000 mark, reflecting a lack of initiation from buyers or sellers. However, the consolidation resonated strictly within two converging trends, indicating the formation of a well-known bullish continuation pattern called a pennant.
Historically, this pattern has been spotted within an established uptrend, as it allows buyers to recoup the exhausted bullish momentum. Currently, the BTC price trades at $118,559, with an intraday loss of 0.21.

If the pattern holds true, the current sideways action will likely end with a bullish breakout from the upper boundary of the triangle structure. A successful flip of the overhead resistance will provide buyers with suitable support to drive a 6.5% surge to hit $126,800, followed by an extended leap to $144,000.
Also Read: Ethereum BlackRock ETF Hits $10B AUM in Just 1 Year: Third Fastest ETF to Do So
