Dogecoin, the largest meme cryptocurrency by market cap, recorded a sudden sell-off during Monday’s U.S. market hours. This downtick likely followed broader market momentum, as a majority of major assets seem to be entering a post-rally correction. Despite the short bearish projection, the DOGE price shows potential for renewed recovery amid the formation of a bullish pattern, and on-chain data hints that major resistance is far.
Glassnode URPD Data Flags $0.36 as Major Resistance Zone
Since last week, the Dogecoin price showcased an upright rally from $0.188 to a recent high of $0.287, accounting for a 57.58% growth. The recovery followed the broader bullish sentiment in the market as the U.S. House of Representatives passed the highly anticipated three crypto bills.
However, the recovery momentum witnessed a slight slowdown during Monday’s trading session as it pushed DOGE to its current trading price of $0.26, projecting an intraday loss of 1.85%.
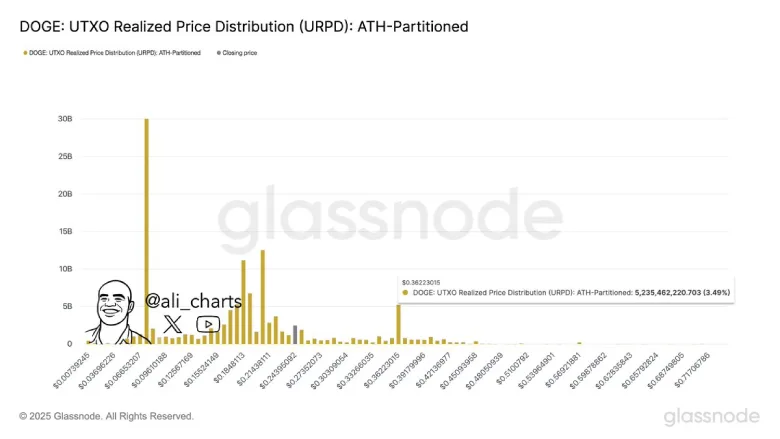
That said, this pullback could allow buyers to recoup the bullish momentum and resume the recovery trend. In a recent tweet, market analyst Ali Martinez also highlighted that DOGE has sufficient room to rally before facing major price resistance. Data from Glassnode’s UTXO Realized Price Distribution (URPD) reveals that a substantial volume of DOGE was last moved at the $0.36 level.

There’s a sharp increase in UTXOs around this level, with over 5.23 billion DOGE (roughly 3.49% of total supply) concentrated at that price. This suggests that a potential price to this level could allow traders in a loss to exit their position at break-even, increasing selling pressure in the market.
Key Support To Watch If Dogecoin Enters Correction Trend
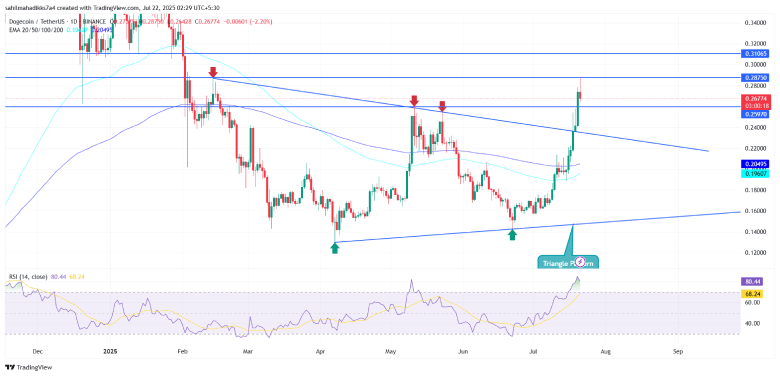
The daily chart analysis of Dogecoin shows the recent price rally gave a decisive breakout from a traditional chart pattern called the symmetrical triangle. Since mid-February 2025, the coin price has resonated strictly within the pattern’s two converging trendlines, indicating an active accumulation zone.
Thus, the recent breakout signals a major change in market dynamics, signaling the start of a fresh uptrend.
However, the daily candle shows a sharp rejection from $0.2875 resistance, signaling overhead supply and risk of pontential pullback. The momentum indicator RSI (87%) surged to an overbought region, reinforce the need for post-rally correction.

If materialized, the price could retest the immediate support of $0.26 or drive an extended correction to the triangle’s breached resistance at $0.22.


