


Ethereum, the second-largest cryptocurrency by market cap, plunged 1.56% during Tuesday’s U.S. trading session. While the selling pressure accelerated due to the broader market downturn, the ETH price shows resilience above key support with a long wick rejection candle. This demand pressure coinciding with a bullish chart pattern, ETF inflow, and steady staking trend signals a potential breakout from the $3,000 barrier in June.
Three Reasons Why Ethereum Price May Reclaim $3,000
By press time, the Ethereum price was trading at $2,500 and maintaining its market capitalization at $301 billion. With today’s price drop, the coin price signals the continuation of ongoing consolidation above $2,400. However, here are three reasons why the ETH price could resume its bullish uptrend in the second half of June.
Ethereum Staking Hits Record High
While the Ethereum price continues to flicker, the on-chain data shows a steady uptrend in staking as it recently recorded a new all-time high (ATH) of over 35 million ETH locked. According to OnChainSchool, more than 500,000 ETH were staked in the first half of June, signaling the increasing trend in Ethereum’s long-term growth.
The surge in staking also limits the liquid supply, as more ETH is locked for yield generation rather than sold on the market.
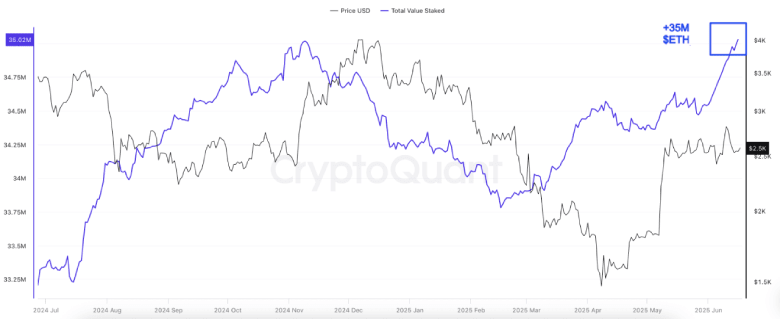
Adding to the bullish note, the accumulation addresses (wallets with no history of selling) have also reached a new ATH, now holding a total of 22.8 million ETH.
The rising trend in staking and accumulation metrics accentuates a strong outlook on Ethereum’s long-term fundamentals and investor conviction.
Ethereum Spot ETFs See 7-Week Inflow Streak
Ethereum cryptocurrency continues to draw strong institutional interest, as the U.S.-based Ethereum spot ETF has now recorded seven straight weeks of new inflow, according to SoSoValue data.
Yesterday (June 16th), these funds saw a fresh capital inflow of $21.3 million, bridging the cumulative net inflow to $3.88 billion.
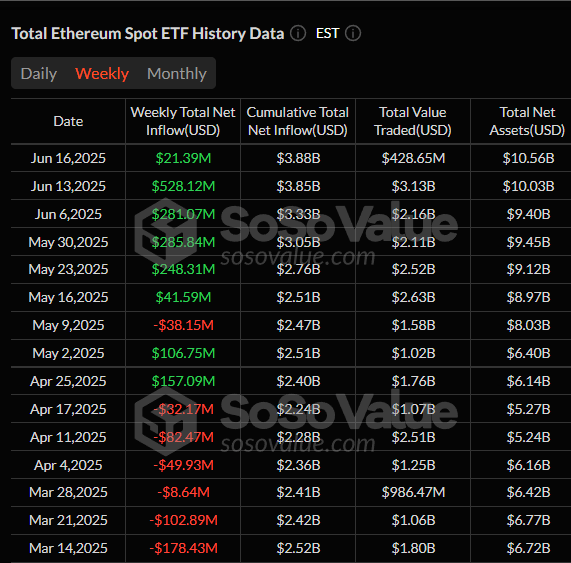
The consistent inflow reflects the growing appeal for regulated ETH products from investors.
Inverted Head & Shoulder Pattern Sets a Rally to $3,000
For over a month, the Ethereum price has resonated within the $2,400 to $2,850 range, reflecting an uncertain market sentiment. This consolidation, when looked at in the daily chart, revealed the formation of an inverted head and shoulder pattern.
The chart setup is commonly spotted at major market bottoms and renews the recovery momentum in price. The long-wick rejection in today’s candle accentuates the intact demand pressure and bullish reversal in ETH.

Thus, the coin price could bounce 13.7% up and challenge the neckline resistance at $2,841. A bullish breakout from this barrier would boost a rally past the $3,000 barrier.
Also Read: Thailand Eyes Crypto Growth with 5-Year Tax Waiver
