- 21Shares’ two new ETFs tied to Polkadot (TDOT) and Sui (TSUI) are now listed on DTCC’s clearing system..
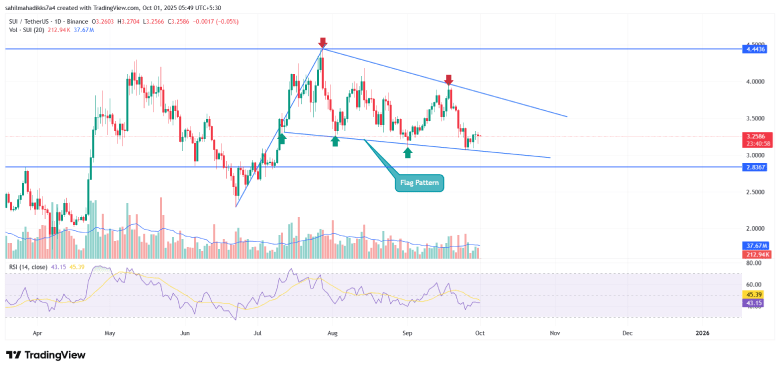
- SUI price is poised for a 13% upswing before the key breakout of the flag pattern formation.
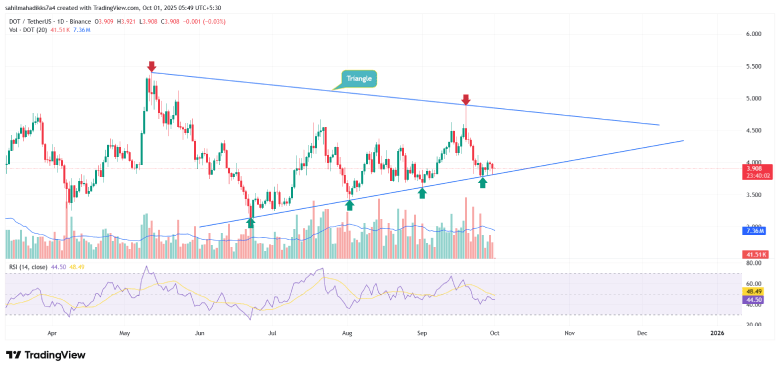
- A symmetric triangle pattern drives the short-term consolidation trend in Polkadot’s price.
On Tuesday, September 30th, the crypto market witnessed a slight downtick as investor sentiment remained uncertain in the U.S. government shutdown and the persistent geopolitical tensions in the Middle East. Amid the pullback, Polkadot and SUI caught market watchers’ attention as their exchange-traded fund from 21Shares got listed on the DTCC website. These altcoins currently seek support at a high area of interest in the technical chart, signalling an opportunity for a rebound.
21Shares Polkadot (TDOT) and Sui (TSUI) ETFs Appear on DTCC Listing
Two new crypto-exposure exchange-traded funds linked to Polkadot and Sui have joined the list of securities hosted by the Depository Trust & Clearing Corporation (DTCC). The products, which will trade under the ticker symbols TDOT for the 21Shares Polkadot ETF and TSUI for the 21Shares Sui ETF, are currently listed on the clearinghouse system used to process securities in the United States.
Market observers generally consider a DTCC appearance as an indication that administrative groundwork for a product is being laid. However, such an action is routine and does not constitute approval of the funds’ regulatory requirements. In addition, the U.S. Securities and Exchange Commission has not confirm these particular offerings, so it is not yet clear when, if ever, trading will commence.
However, there has been an uptick in online activity for both tickers even though they haven’t announced a launch date. Trading communities and social media outlets have seen a growing amount of attention, with users speculating about the potential launch of new digital asset ETFs. The activity has more to do with expectations of a possible future product than underlying network developments for Polkadot or Sui.
If approved, TDOT and TSUI could provide new demand for Polkadot and Sui by moving traditional capital into the tokens through regulated investment vehicles.
SUI Price Analysis
Since last weekend, the SUI price has bounced from $3.07 to $3.25, accounting for a 5.92% jump. The daily chart analysis shows this upswing is positioned at the support trendline of a bullish continuation pattern called ‘flag’.
The recent history of this pattern shows that a reversal from the bottom trendline has bolstered price, with gains ranging from 27% to 30%. If history repeats, the coin price could bounce another 13% before challenging the flag pattern resistance at $3.68.
A potential bullish breakout from this pattern would signal the continuation of the prevailing recovery and set its next leap toward the $4.83 mark.

However, the current correction could prolong into late October if sellers continue to defend the overhead trendline.
Polkadot Price Analysis
Over the past five weeks, the Polkadot price has been traveling in a sideways trend, resonating within the two converging trendlines of a symmetrical triangle pattern. These trendlines act as dynamic resistance and support for traders as they force the price into a narrow space, setting it up for a major breakout in the near term.
With today’s drop of over 2%, the coin price retested the triangle’s bottom trendline, seeking bullish support. If the buyers continue to defend this floor, the price could bounce 22% and challenge the pattern’s resistance trendline at $4.76.

A bullish breakout from this resistance will accelerate the bullish momentum and signal the end of a long accumulation phase.


