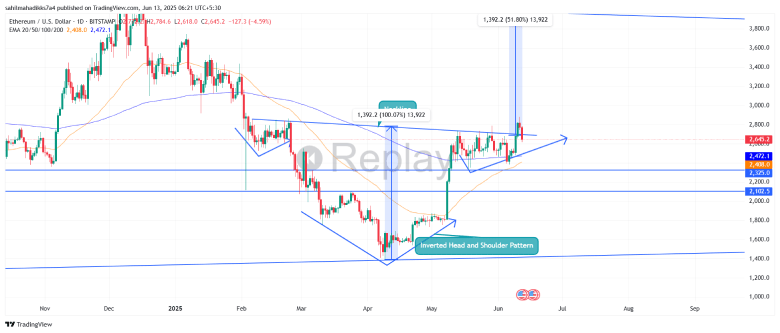
On Thursday, June 12th, the Ethereum price tumbled over 4.3% to reach a trading value of $2,654. The selling pressure likely followed a broader market pullback as Bitcoin failed to sustain above $110,000. Our analysis of the daily chart reveals that the falling ETH price has broken below a key support level, further increasing the risk of a prolonged decline. Will the coin price plunge to $2,000, or will buyers have an opportunity to counterattack?
Ethereum Price Fails Bullish Pattern Breakout
Since last weekend, the Ethereum price has experienced a notable recovery, rising from $2,385 to $2,880, representing a 20% growth. This uptrend validated Ethereum’s sustainability above the 200 exponential moving average and provided a bullish breakout from the neckline resistance of an inverted head-and-shoulders pattern.
This chart setup is typically formed at the bottom of a downtrend, and the recent breakout reinforced Ethereum’s potential to drive a prolonged recovery. However, with today’s intraday sell-off, the coin price reverted below the neckline support of $2,700, indicating a risk of bullish invalidation.
According to the Coinglass derivative market data, the price decline triggered a long liquidation of $99.26 million of traders whose sell orders in the market would support downside momentum.
Thus, the Ethereum holders must watch for a daily candle closing below today’s low of $2,618 as a signal of continued correction. If it materializes, the coin price could tumble 12% and challenge the monthly support of $2,325.

A bearish breakdown below this support would accelerate the bearish momentum, driving a correction towards $2,000.
Triangle Pattern Drives Major Trend
According to higher-timeframe analysis, the Ethereum price has been oscillating within two converging trendlines since late 2021. This sideways action reveals the formation of a symmetrical triangle pattern, which typically drives a sideways action to build up sufficient momentum for a higher rally.
If this pattern holds true, the current short-term consolidation of the Ethereum price would eventually turn around and drive a rally towards the $3,900 high and challenge the triangle resistance.

On the contrary, if the equilibrium pressure and supply pressure at the triangles are found to be long-term, then this trend will go on for months to come.
Also Read: XRP Faces Pivotal Month as Technical and Corporate Forces Collide


